Download
1 / 5
50 likes | 170 Views
Altersstruktur der OberösterreicherInnen 2005, 2020 und 2040. Geburtenausfall im 1. Weltkrieg. Wirtschaftskrise der 30er Jahre. Baby-Boom nach dem Anschluss ans deutsche Reich. Geburtenausfall zum Ende des 2. Weltkrieges. Baby-Boom der 1960er Jahre. Geburtenrückgang der 70er Jahre.

E N D
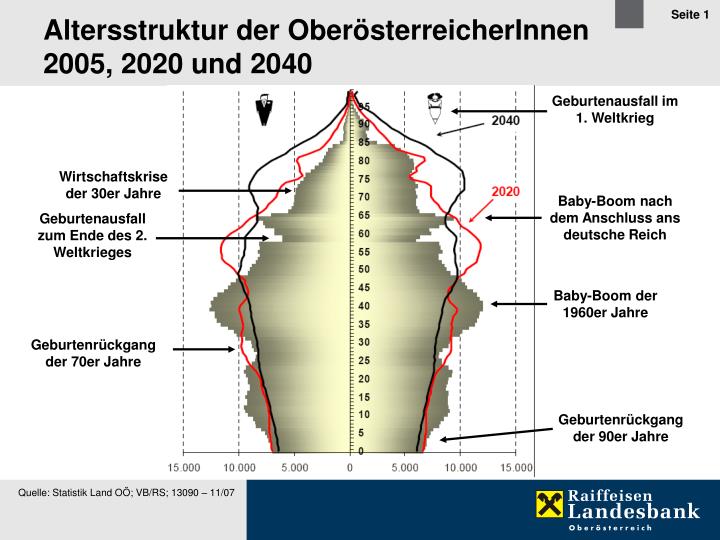
Altersstruktur der OberösterreicherInnen 2005, 2020 und 2040 Geburtenausfall im 1. Weltkrieg Wirtschaftskrise der 30er Jahre Baby-Boom nach dem Anschluss ans deutsche Reich Geburtenausfall zum Ende des 2. Weltkrieges Baby-Boom der 1960er Jahre Geburtenrückgang der 70er Jahre Geburtenrückgang der 90er Jahre Quelle: Statistik Land OÖ; VB/RS; 13090 – 11/07
Durchschnittliche Haushaltsgröße in Personen - Oberösterreich Quelle: Statistik Austria; VB/RS – 11/07
Ein- und Mehrpersonenhaushalte in Oberösterreich Quelle: Statistik Austria; VB/RS – 11/07
Geburtenrate Oberösterreich Quelle: Land OÖ; VB/RS – 11/07
Entwicklung der Erwerbstätigenstruktur Oberösterreich, 2001 bis 2050 Erwerbstätige in 1.000 Personen: 647 674 698 666 625 Quelle: Statistik Austria; VB/RS – 11/07