Download

1 / 10
100 likes | 133 Views
Learn how the binomial test assesses population proportions with two distinct categories (A and B) and how the sign test compares treatment conditions, evaluating if increases and decreases are equally likely.

E N D
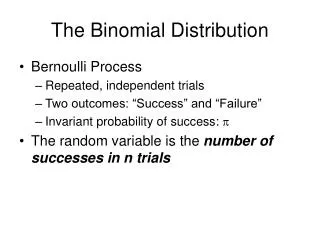
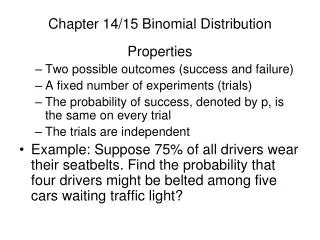
The Binomial Test • The binomial test provides a method for testing hypotheses about population proportions for populations consisting of binomial data. • Binomial data exist when the measurement procedure classifies individuals into exactly two distinct categories.
The Binomial Test (cont.) • Traditionally, the two categories are identified as A and B, and the population proportions are identified as p(A) = p and p(B) = q. • The null hypothesis specifies the values of p and q for the population. • For example, when testing whether or not a coin is balanced, the null hypothesis would state that the coin is balanced or, p(Heads) = p = .50, and p(Tails) = q = .50.
The Binomial Test (cont.) • The sample data for the binomial test consist of a sample of n individuals each of whom is classified in category A or B. • The sample statistic, X, is simply the number of individuals classified in category A. • The logic underlying the binomial test is identical to the logic for the original z‑score test or the t‑statistic hypothesis tests.
The Binomial Test (cont.) • The test statistic compares the sample data with the hypothesized value for the population. • If the data are consistent with the hypothesis, we conclude that the hypothesis is reasonable. • However, if there is a large discrepancy between the data and the hypothesis, we reject the hypothesis.
The Binomial Test (cont.) • When the values of pn and qn are both greater than or equal to 10, the binomial distribution is approximately normal with a mean of μ = pn and a standard deviation of σ = npq. • In this case, the binomial test can be conducted by transforming the X value from the sample into a z-score and then using the unit normal table to determine critical values. • If the z-score is only slightly into the critical region, you should check both real limits for X to ensure that the entire score is beyond the critical boundary.
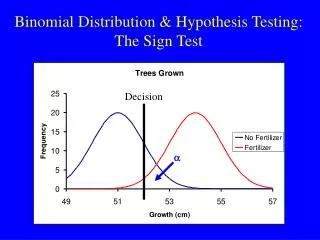
The Sign Test • The sign test is a special application of the binomial test used to evaluate the results from a repeated-measures research design comparing two treatment conditions. • The difference score for each individual is classified as either an increase (+) or a decrease (–) and the binomial test evaluates a null hypothesis stating that increases and decreases are equally likely: p(+) = p(–) = 1/2.