Download
1 / 29
290 likes | 503 Views
Update on Community Partnerships Carrie B. Feliz, MPH Director, Strategic Community Partnerships Office of Educational Partnerships January 27, 2014. Presentation Outline. Overview of Community Partnerships Selected Community Partner Profiles Lessons Learned & Tools

E N D
Update on Community Partnerships Carrie B. Feliz, MPH Director, Strategic Community Partnerships Office of Educational Partnerships January 27, 2014
Presentation Outline • Overview of Community Partnerships • Selected Community Partner Profiles • Lessons Learned & Tools • Next Steps to Support Effective Partnerships
The Challenge • Create a comprehensive system of supports responsive to the academic, social, and emotional developmental needs of children and families • Requires a whole child approach that ensures that students are (RIASCD) • Healthy • Safe • Engaged • Supported • Academically challenged
Value-add of Community Partnerships • In order to achieve the goal of graduating students who are prepared to succeed in college, career and life, educators must apply a whole child approach • Community partners can help schools achieve their educational goals by addressing factors that influence children’s learning within and outside of school buildings • Community partners also assist families with school engagement and skill-building to maximize their role as educational partners
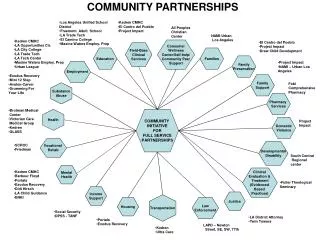
Goals: • Shared school / community effort to advance student success • Have a positive impact on student and family needs • Build an effective RTI system • Aligned student outcomes Tools & Inputs: • PPSD Strategic Plan • Children & Youth Cabinet • Formal relationships with community initiatives & intermediaries • Information systems and referral process (protocols and guidelines) • Performance-based contracts Outcomes: • Improved student and youth outcomes • Shared accountability, reporting, and learning • Increasingly effective community / school partnerships • Coordinated systems RtI • Needed from individual SCHOOLS: • Integrated school / community teams to review and use school data for targeted interventions • Capacity building for integrated teams for data use, decision-making, and school improvement • Ensure alignment of community partners and services with School Improvement Plans • Barriers: • Limited school-level coordination beyond the principal • Limited capacity and time for site-level coordination and ongoing planning with community stakeholders • Inconsistent access to student information • Consistency around working with existing intermediaries to coordinate school-level work • Resistance to change • Needed from the DISTRICT: • Expanded RtI policy and framework • Early-warning systems to target student needs and alternative interventions • Tools and process to assess school needs • Procedure to align partners with PPSD strategic plan and school improvement plans • Improved information systems and data-sharing agreements to mutually share and use individual student data • Process to evaluate and improve partnerships • Barriers: • Capacity to lead and support initiative • Clearly defined vision, procedures, communication, and roles for district, schools and community • Resistance to change IndividualSchools A BLUEPRINT for CHANGE: A District, School, and Community Partnership to Advance Youth Outcomes through Response to Intervention District Community • Needed from the COMMUNITY: • Align services with PPSD strategic plan and school improvement plans • Commitment to work as a coordinated team with other partners at individual schools • Provide and participate in integrated professional development and technical assistance • Willingness to work differently with all stakeholders • Barriers: • Access to student-level information • Desire for individual rather than team access to principals, information, other school leaders • Lack of resources for consistent assessment and evaluation of activities and impacts • Lack of trust /competition for resources among partners • Resistance to change
Breadth of Community Partners • Contracted, Volunteer, and Self-funded • Large and Small • In school and Out of School • One-time and Ongoing Relationship • Professional and Near-peer • Grassroots and Institutional
Number and Scope of Partnerships • More than 100 different entities • Approximately twice as many at elementary than middle; high school is more than middle
Community Partner Snapshot– Full Service Community Schools • Goal: A Full Service Community School supports the whole child and family by providing community resources within a school and by collaborating with faculty, parents and students • Began in 2008-09 school year, currently in 5 elementary schools • Collaboration of 4 agencies with PPSD (YMCA, Family Services of RI, Dorcas International Institute or RI, Capital Good Fund) • 2-generation model • School day, Out of School, Summer programming • PPSD Investment = $1,023,245 (54% budget)
FSCS Enrollment A total of 2,740 children in 2011‐2012 met the minimum participation requirements in the different programs across all four schools. In all, 3,357 children across all four sites participated in FSCS activities. In 2011 – 2012, 666 parents also participated in one or more services. Average approx. 110 unduplicated children and 130 unduplicated adults per school Across the four schools, 1,607 attended at least one parent engagement event and 357 attended 3 or more.
Community Partner Snapshot– FSCS • Increase participant literacy • In 2011‐2012, 94% of children participating in OST maintained or accelerated their reading pace, with an average increase of 24% • 48% of parents increased their educational functioning by 1 level (approx. 2 grade levels in reading) • Increase school attendance • Of 267 participants in Out of School Time, 45% fewer children experienced chronic absenteeism in comparison with the general school population
Community Partner Snapshot– FSCS • Increase participants’ health and wellbeing • 57 of the 100 families were classified as in crisis or vulnerable. Of these, 24 (42%) increased their sufficiency by 10%, representing improvement in at least 3 of the 18 domains assessed. • Improve School Climate • 51 parents (60%) increased their scores on at least three domains of the Parent Education Profile to measure school engagement.
Community Partner Profile – City Year • Goal: Dramatically reduce dropout crisis • Began in 1993 in Providence • Whole School, Whole Child approach • Focus on ABCs- Attendance, Behavior, Course Performance • Near-peer corps members serve 1-2 years in a school • Currently supporting 4 schools • PPSD Investment = $400,000/yr (24% budget)
Community Partner Profile – City Year • In FY13, City Year teams supported 53 teachers in five schools with whole-class academic support and classroom management assistance • 97% of teachers reported being satisfied or very satisfied with the overall impact of their partner corps member on their students/class • Tier I / Universal Interventions • Get Schooled and Hot 106 Attendance Challenge • Literacy Weeks/Scholastic Book Fairs • Before school programs to increase attendance and reduce tardiness
Community Partner Profile – City Year • Tier II / Strategic Interventions • Attendance • In FY13, 130 students completed at least eight weeks of attendance coaching. • 49% of the chronically absent students improved their average daily attendance. • 376 school days were recovered
Community Partner Profile – City Year • Tier II / Strategic Interventions • Behavior • 80 students in grades 3-8 participated in City Year’s 50 Acts of Greatness (3rd-5th grade) and 50 Acts of Leadership (6th-8th grade) research-based, social-emotional learning curriculum. • Students develop age-appropriate leadership and social emotional capacities including teamwork, appreciation of inclusivity, communication and conflict resolution, as well as fostering a sense of school connection and community mindedness by provide opportunities for students to serve the school community.
Community Partner Profile – City Year • Tier II / Strategic Interventions • Course Performance • In literacy, 248 students were on City Year’s focus list. 52% of middle school students who received 15 hours of tutoring moved from off-track (a course grade of a D or lower) to on-track, with a C or higher. In grades 3-5, 100% of students receiving literacy intervention increased their DIBELS oral reading fluency score from start of year to end of year. • In math, 160 students were on the City Year focus list. 54% of students saw a raw score improvement on their STAR assessment. 21% improved by at least one letter grade.
Community Partner Profile - PASA • Goal: expand and improve quality after-school, summer, and other expanded learning opportunities for the youth of Providence • Serve all middle schools with AfterZone and Summer Scholars • Serve 3 high schools with ELOs • PPSD Summer Scholar Investment = $432,000 (49% budget) • PPSD ELO Investment = $56,000 (25% budget)
Community Partner Profile - PASA 2012-13 AfterZone participation as compared to school enrollment *Taken from RIDE October Enrollment report **PASA provides a summer AfterZone only for Nathanael Greene- totals do not reflect this additional school because it does not host a full AfterZone school year program.
Community Partner Profile - PASA • Summer Scholars Outcomes, Survey of Academic and Youth Outcomes • Approx. 700 students served • Teachers perceived largest improvements in: • Problem-solving • Communication skills • Readiness to return and engage in school in the fall • Youth reported greatest program strengths as: • Supportive adults • Enjoyment and engagement • Youth challenge • Teacher and Youth data both support that the program was effective for all youth
Community Partner Profile - PASA 2011-13 Hub Expanded Learning Opportunities (ELO) Participation Summary *The program was expanded to Alvarez High School in Winter 2013
Community Partner Profile - PASA Diversity of ELO Programs, 2012-13
From Individual Action to Collective Action Individual Action = Isolated Impact
From Individual Action to Collective Action Coordinated Action = Cumulative Impact Individual Action = Isolated Impact
From Individual Action to Collective Action • Coordinated Action = Cumulative Impact Individual Action = Isolated Impact Collaborative Action = Collective Impact
Partnership Keys to Success • Alignment with district and school goals • Coordination of partners within the school • Sufficient training and ongoing support • Access to data and feedback for continuous improvement • Effective programs, implemented with fidelity • Network with educators, parents, and other partners to be student-centered
Tools / Products • Partnerships Database / Partner Profiles (PPSD) • Repository of information on all school partners to inform decision-making • Conditions for Successful School-Community Partnerships (PPSD) • Guidance tool for school leaders during the planning, implementation, and review phases of a partnership to ensure that the partnership will be effective and responsive to school improvement goals • Partnerships Rubric (Partnerships for Success) • Evaluative tool to assist practitioners in identifying the current phase of their partnership and highlighting ways to deepen effectiveness and improve overall practice
Next Steps to Support Effective Partnerships • Focus on quality • Data to guide decision making • Proven programs • Fidelity to model • Support for School Leaders • Populating database • Detailed information on partners, menu of services available • Support for Partners • Clarify district and school priorities • Create opportunities for interagency collaboration • Encourage program evaluation • Explore performance-based contracting