Download
1 / 45
450 likes | 600 Views
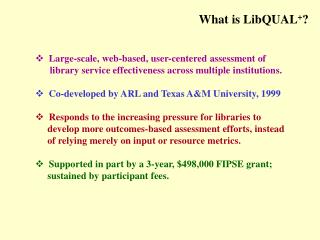
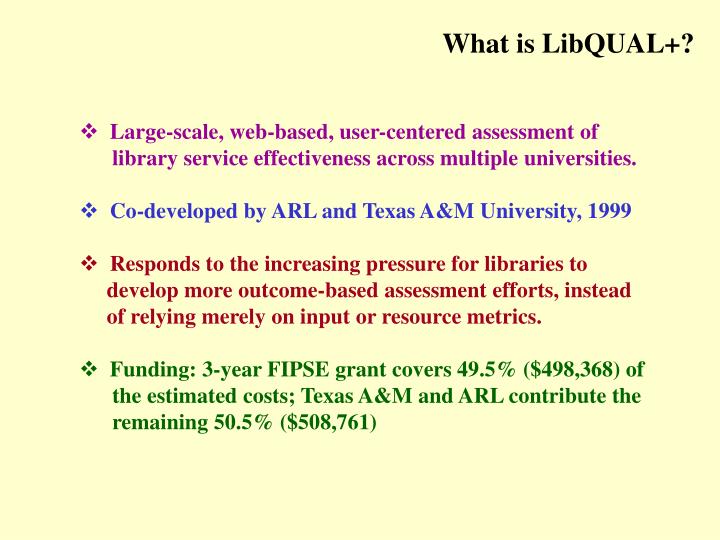
What is LibQUAL+?. Large-scale, web-based, user-centered assessment of library service effectiveness across multiple universities. Co-developed by ARL and Texas A&M University, 1999 Responds to the increasing pressure for libraries to

E N D
What is LibQUAL+? • Large-scale, web-based, user-centered assessment of library service effectiveness across multiple universities. • Co-developed by ARL and Texas A&M University, 1999 • Responds to the increasing pressure for libraries to develop more outcome-based assessment efforts, instead of relying merely on input or resource metrics. • Funding: 3-year FIPSE grant covers 49.5% ($498,368) of the estimated costs; Texas A&M and ARL contribute the remaining 50.5% ($508,761)
What is LibQUAL+?(The “Gap Theory” model and 5 original dimensions of service quality) • Grounded in the “Gap Theory” of Service Quality; based • on SERVQUAL model developed by Parasuraman et al (Texas A&M); addresses a set of five service dimensions: • Tangibles—appearance of physical facilities, equipment, personnel, and communication materials; • 2.Reliability—ability to perform the promised service dependably and accurately; • 3. Responsiveness—willingness to help customers and provide prompt service; • Assurance—knowledge and courtesy of employees and their ability to convey trust and confidence; and • 5.Empathy—thecaring, individualized attention the organization provides its customers.
What is LibQUAL+?(The 4 new dimensions of service quality) • LibQUAL+ adds 4 more dimensions of service quality, specific to libraries: • Access to Collections—local & remote, print & electronic, general and special; convenience of access, etc.; • 2.Library as Place—secure, safe, comfortable, conducive to study; • 3. Self Reliance—enabling the user to work independently; • Instruction—adequate and appropriate instructional services.
The goals of LibQUAL+ • Development of tools and protocols for evaluating library service quality; • Development of effective web-based delivery mechanisms; • Identification of best practices; and • Establishment of a service quality assessment program.
Overall project timeline • Phase 0 (2000): Pilot; 12 ARL libraries survey 5,000 users • Phase 1 (2001): 43 ARL libraries survey 20,416 users • Phase 2 (2002): 200+ libraries (incl. OhioLINK, AAHSL, int’l, community college) test a shorter, more refined instrument (25 questions) • Phase 3 (2003): End of grant; final revisions to instrument.
Who participated in Phase 1? American University University of Arizona Arizona State University University of Arkansas Baylor University Brigham Young U. Clemson University University of Colorado Cornell University Emory University University of Guelph University of Houston University of Illinois/UC Indiana University University of Iowa 43 ARL libraries, including 21GWLA members Oklahoma State University University of Oregon Oregon State University University of Pittsburgh Southern Illinois University University of Texas Texas A&M University Texas Tech University University of Utah Virginia Tech Washburn University University of Washington Washington State U. University of Waterloo Wayne State University Iowa State University University of Kentucky McGill University University of Maryland Miami University, Ohio Michigan State University University of Minnesota University of Mississippi University of Missouri University of Nebraska University of New Mexico Northwestern U. Health Sci Lib Ohio University
Checklist of local activities • Gather random sample (1,200 U-grads; 800 grads; 800 faculty) • Prepare website to manage publicity, communication, etc. • Send “pre-survey” message from Dean (March 28) • Send email with imbedded URL for online survey (April 1) • Send 2 reminders from the Dean (April 4 & 9) • Survey closes on April 13, 2001 • Announce incentive prize winners (May 10)
717 of the 2,800 users surveyed (25.6%), including: 291 of the 800 faculty surveyed (36.4%) 230 of the 800 graduate students surveyed (28.8%) 196 of the 1200 undergrad students surveyed (16.3%) Who responded at ISU?(Response rates for faculty, grads, undergrads) ISU ranked 7th in the number of surveys completed! Range was 173-1000.
Who responded at ISU?(By subject area) Engineering Science Ag/Environ. Soc Science Performing & Fine Arts Humanities Education. Business Other Health Sci Architecture. Genl Studies Undecided
Who responded at ISU?(By age & Sex) Age Sex 19% 25.8% 36.3% 31.1% 24.1% 63.7%
Who responded at ISU?(Frequency of library use) I use the library electronically… I use the library on premises… 0.8% 6% 8% 13% 16% 12% 33% 45% 23% 43%
= Minimum Question 1 Sample spider graph = Perceived = Desired Question 5 Question 2 Question 4 Question 3
Perceived > Desired Perceived < Desired Perceived > Minimum Perceived < Minimum Aggregate data (all universities, all users) Complete runs of journal titles Accuracy in the catalog, borrowing, and overdue records Text box
Perceived > Desired Perceived < Desired Perceived > Minimum Perceived < Minimum Comparison: Aggregate data (all users) All Universities ISU Complete runs of journal titles Text box Text box Accuracy in the catalog, borrowing, and overdue records
Comparison: Aggregate data (all users) Comparison: Aggregate data (all users) – TABLE Text box Text box
Perceived > Desired Perceived < Desired Perceived > Minimum Perceived < Minimum Comparison: Undergraduate Students All Universities ISU Text box Text box Accuracy in the catalog, borrowing, and overdue records
Comparison: Undergraduate Students Comparison: Undergraduate Students – TABLE Text box Text box
Perceived > Desired Perceived < Desired Perceived > Minimum Perceived < Minimum Comparison: Graduate Students AllUniversities ISU Complete runs of journal titles Convenient business hours A haven for quiet and solitude Text box Accuracy in the catalog, borrowing, and overdue records Text box Space that facilitates quiet study
Comparison: Graduate Students Comparison: Graduate Students – TABLE Text box Text box
Perceived > Desired Perceived < Desired Perceived > Minimum Perceived < Minimum Comparison: Faculty AllUniversities ISU Complete runs of journal titles Comprehensive print collections Text box Accuracy in the catalog, borrowing, and overdue records Text box
Comparison: Faculty Comparison: Faculty – TABLE Text box Text box
Perceived > Desired Perceived < Desired Perceived > Minimum Perceived < Minimum Dimensions: Aggregate (All ranks) All Universities ISU Text box Text box
Perceived > Desired Perceived < Desired Perceived > Minimum Perceived < Minimum Dimensions: Undergrad Students All Universities ISU Text box Text box
Perceived > Desired Perceived < Desired Perceived > Minimum Perceived < Minimum Dimensions: Graduate Students All Universities ISU Text box Text box
Perceived > Desired Perceived < Desired Perceived > Minimum Perceived < Minimum Dimensions: Faculty All Universities ISU Text box Text box
Comparing the gap between perceived and minimum levels of service… Comparing Gap 1:Perceived – Minimum All Universities ISU
Comparing the gap between desired and perceived levels of service… Comparing Gap 2:Desired – Perceived All Universities ISU
Comparison of Minimum Expectations All Universities ISU
Comparison of Desired Levels of Service All Universities ISU
Comparison of Perceived Levels of Service All Universities ISU
Conclusions… Conclusions:6 items with largest gapDesired – Perceived
Conclusions… Conclusions:6 items with smallest gapPerceived – Minimum
Conclusions… Conclusions:6 items with largest gapPerceived – Minimum
Conclusions… Conclusions:6 items with smallest gapDesired – Perceived
Next steps • Complete a summary report of findings, to inform • operational planning for 2002 • Explore opportunities to compare findings with • colleagues (UI, GWLA, etc.) • Repeat survey in 2003 (and bi-annually thereafter); • watch the trajectories • Consider focus groups to examines areas of concern?