Download
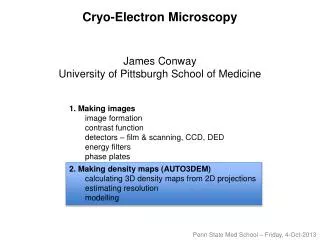
1 / 58
600 likes | 763 Views
Introduction to Light and Electron Microscopy. Introduction to Optics Part I James Bouwer. NEU 259. Spring 2007. Some Length Scales:. 1mm = 1m / 1000 millimeter 1 m = 1mm / 1000 micron 1 nm = 1 m / 1000 nanometer ~10 atoms. Nature of Light:. Particle Nature:

E N D
Introduction to Light andElectron Microscopy Introduction to Optics Part I James Bouwer NEU 259 Spring 2007
Some Length Scales: • 1mm = 1m / 1000 millimeter • 1 m = 1mm / 1000 micron • 1 nm = 1 m / 1000 nanometer ~10 atoms
Nature of Light: • Particle Nature: • We can treat light as particles that move in straight lines or rays • Wave Nature of light: • We can treat light as a propagating electromagnetic wave Where = wavelength of light (visible light ~400 to 700nm) f = frequency of waves c = speed of light in a vacuum (3.0 x10⁸ m/sec)
Nature of Particles: • Particles also have a wavelength when moving • de Broglie Wavelength: Where: h = Planck’s constant (6.63 x 10⁻³⁴ Kg m/sec) m = mass of the particle = velocity of the particle
Optics I What is the refractive index n… really? • n is the ratio of the speed of light in a vacuum to the speed of light • in the medium • n determines how much the light is bent as it enters a medium such as glass
North Wavefront Lensing at Rincon
Refraction: • Snell’s Law: n = refractive index of medium • Examples: • Ocean waves always approach the shore nearly perpendicular • Swimming pools always look shallower than they really are… • belly flops are always safe!
red n1 n2 green The refractive index depends of wavelength: • Light of different colors is bent by different amounts: Refractive index vs wavelength • Bending of trajectories is the basis for all lenses including electron magnetic lenses
f f Thin Spherical Lenses • Ability to focus parallel light to a point or a virtual point Converging Lens: Diverging Lens:
image object Forming Images with Lenses Lens equation: Magnification:
Image Formation Using Light Rays: • How Images are formed: • An image plane is formed when all the light from a single point on an object • … here the tip of an arrow... recombines on the othere side of the lens to form • the image. • Rules for drawing ray diagrams: (see lens diagrams on previous page) • 1. Parallel light always goes through the focus on the other side of the lens. • 2. Light traveling through the center of the lens is undeflected. • 3. Light traveling through the focus comes out of the lens parallel on the other side.
Types of Images: • Real images: • These are images that can be created on a screen… • Movie Projector • Virtual images: • These are images that cannot be projected on a screen • and must be viewed with the eye… • Magnifying Glass • Diverging Lens
Light Collection Efficiency • Three things most strongly affect light collection efficiency: • Reflection at the lens surface • Distance of object from lens • Size of the lens • The last two combine to from what is called Numerical Aperture: • Numerical apertures range from 0.1 to 1.45 for LM objective lenses: • Oil immersion lenses can increase NA by increasing n of the medium • Light collection efficiency of 5% is considered extremely good
Limits of the Optical Imaging System: The diffraction limit: • As a general rule the best resolution theoretically attainable for • any imaging system is given by : • More accurately the resolving power for an optical system is given by:
What Does the Resolving Power or Diffraction Limit Mean: What is ? represents the way each point is transferred to the image through the lens: • For an optical system, the best attainable resolution is on the order of • = 250 nm
500nm The Diffraction Limited Spot A bright point source imaged on film Two bright point sources just separated by the resolvable diffraction limit • This is sometimes called the point spread function (PSF) • The center of the PSF can be located in an image and a point can be assigned • to that center. This is the basis of deconvolution software.
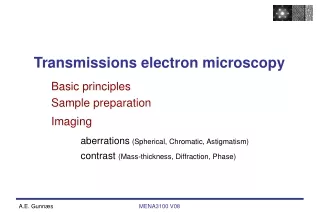
Electron Microscope Resolution: • Wavelength of an electron accelerated by a voltage, V: • Where: • V = accelerating Voltage in Volts • = relativistic correction factor (typically between 1 and 2 for standard EMs) • Wavelength of an electron accelerated by a 400,000 volt EM 400KeV = 0.004 nm • Due to spherical aberration in the lenses the best resolution attainable on modern • EMs is around 0.10 nm or about the size of an atom.
Spherical Aberration • Results from using lenses that are ground with spherical surfaces Focal length depends on the ray position • is termed the circle of least confusion • Spherical aberration tends to worsen the resolution of the microscope beyond • the diffraction limit… especially true for EM • Spherical aberration can be corrected with expensive aspherical lenses
n vs. A prisim separates colors Chromatic Aberration • Chromatic aberration results from the fact that • the refractive index, n varies with • Lenses have the same problem with colors Chromatic aberration causes serious problems for trying to perform co-localization experiments
blue white red white red blue Converging lens Diverging Lens Achromatic Doublet Fixing Chromatic Aberration • For a typical system red is bent less than blue:
Object Image Distortions • Two types of lower order distortions: I) Barrel Distortion:
II)Pincushion distortion: Image Object
Further object image Closer Origin of Pincushion and Barrel Distortions: Magnification • These distortions arise from the fact that various points in the object are • closer or further from the lens and therefore, have different magnification
Correcting Barrel and Pincushion Distortion • Combinations of lenses can be used to solve many problems
Other Types of Distortion • Coma: Off-axis aberration resulting from a variation of lens focal lengths • when moving out from the center of the lens • Astigmatism: Aberration that results in off-axis light bundles to focus to an ellipse rather than a circle
Optical Instruments: Simple Compound Microscope
A Real Objective Lens: A 10 element, 1.3 NA oil immersion objective Front element
Analogy between Transmission Light and Electron Microscopes:
Outline of Topics Part II • Photon Energy • Fluorescence Microscopy • -Two level system • -Fluorophores and Spectra • -Epifluorescence • Interference Optics • -diffraction grating • -interferometer • Polarization of light • DIC microscopy
Energy of a Photon the Particle Nature of Light (the Quantum) h = 6.62 x 10⁻³⁴ Joule*sec f = frequency of light c = 3.0 x 108 = speed of light (meters/sec) = wavelength (meters)
How Energy Depends on Wavelength 1eV = 1.6x 10⁻¹⁹ Joules
S S S S A As A As - O O O h E2 h E1 O2- C E0 F l A s H - E D T 2 g r e e n f l u o r e s c e n c e , F R E T f r o m C F P Fluorescence Microscopy A Typical Fluorescent Molecule A Two Level Model of Fluorescence = 10-10 sec = 10-7 sec
Commonly used Fluorophores for Multi-Color Labeling Fluorescein goat anti–mouse IgG antibody DAPI / DNA Rhodamine Red-X goat anti–mouse IgG antibody
Criteria for Fluorophore Selection • Excitation Spectrum: • Damage to Sample? (Shorter Wavelengths are most damaging) • Do excitation spectra overlap? • Correct excitation and emission filters • Emission Spectrum: • How broad is the emission spectrum • What is the quantum efficiency of the fluorophore • - ranges between 0-1 (0-100%) • describes percent of absorbed photons that emit fluorescence • Does the fluorophore create singlet state reactive O2 - damaging to live cells
Epi-fluorescene Filter Setup CCD Camera Hg or Xe Lamp Other Methods: Laser Scanning Confocal Two-photon excitation
Fluorescence Microscope Image of Rat Cerebellum Green = GFAP Red = IPR3 receptor in purkinje neuron
DiA DiO DiD … A Tough Case
Image1 (Green) The solution…Bleedthrough Subtraction Image2 (Green Bleedthrough) + (Orange) Orange Image - x = (%Bleed) Steps: 1. Detemine bleedthrough percent 2. Subtract fraction of bleedthrough image from other image
Filament image Kohler Illumination • Method to ensure uniform illumination • Across the sample plane • Ensures that the filament image is in • the back focal plane of the objective • (No where near the image plane) • Ensures matched NA of the illumination • and cone and the objective lens
Filament Vs. Sample Image Planes for Kohler Illumination Demonstration later showing how to align for Kohler illumination
The Wave Nature of light Use of Phase Relationships In Microscopy What is a phase relationship: 360 2A • Phase differences • can create interference • Constructive • Destructive = 2 - 1
Interference as a Way to Measure Spectra (Wave Properties of Light) Two Slit Interference: Constructive Interference: (m = 0, 1, 2, 3 …) Destructive Interference: (m = 0, 1, 2, 3 …)
Diffraction Grating m = 1 m = 1 constructive interference:
movable d Interferometer • Used to measure very small translations • Accurate to ~ 1/20 wavelength of light • Constructive interference fringes when • ∆d = ( / 2)/2 Detector Output
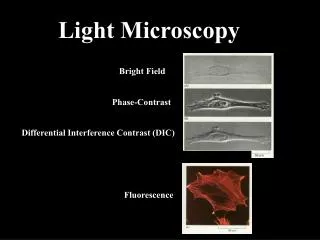
Phase Contrast Microscopy Utilizes differences in the refractive index (n) of the Sample to Produce Contrast Frits Zernike (Holland) - 1934 Typically differences in light absorption between cells, membranes, and cellular organelles vs. the surrounding medium (water) are negligible; therefore yielding these entities barely visible with brightfield illumination. Luckily, differences in the index of refraction (n) of lipid bilayers and water are significant enough to introduce phase differences. These phase differences can be utilized to produce contrast through interference. Board demo!
The Phase Contrast Optics Interference in the image Side view Backfocal plane of the condenser lens (introduce light from a specific angle) [surround light] Backfocal plane of the objective lens (introduce a 90° phase shift to the surround light relative to the diffracted light)
Phase Contrast Images Positive vs. Negative Phase Shift Ctenoid Fish Scale Positive phase shift in phase plate Negative phase shift in phase plate
Polarization of Light E fields E fields Maxwells Eqs determine the propogation of light:
+ Transmission through a Polarizer