Download
1 / 13
130 likes | 237 Views
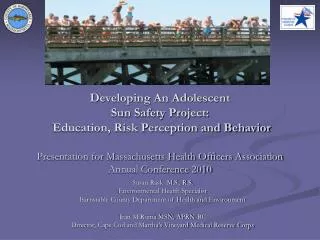
Presented by Susan Rieves-Austin, M.S. Youth Risk Behavior Survey Results – Rx and OTC 2009 – 2011 Survey USA Phone Poll Results Sept 2010 & Sept 2011.

E N D
Presented by Susan Rieves-Austin, M.S. Youth Risk Behavior Survey Results – Rx and OTC 2009 – 2011Survey USA Phone Poll Results Sept 2010 & Sept 2011 Roanoke Valley data includes Botetourt, Craig, Roanoke City, and Salem Presentation by Susan Rieves-Austin
Roanoke Valley Youth Risk Behavior Survey (YRBS) Resultsfor the counties of Botetourt and Craig and the cities of Roanoke and SalemAndSurvey USA Phone Poll Resultsfor the counties of Botetourt, Craig, and Roanoke and the cities of Roanoke and Salem DISCLAIMER: This is NOT research that is being shared…this is data that represents snapshots in time and comparisons of those snapshots
Youth Risk Behavior Survey Details 2009 & 2011 consistency across questions and responses 2009 High School n = 2,119 2011 High School n = 1,977
Roanoke Valley data includes Botetourt, Craig, Roanoke City, and Salem Presentation by Susan Rieves-Austin
Roanoke Valley data includes Botetourt, Craig, Roanoke City, and Salem Presentation by Susan Rieves-Austin
2010 & 2011 Phone Poll Comparisons Phone poll was implemented on Sept. 7, 2010 and Sept. 27, 2011 Survey USA completed both surveys Identical questions were used Rx RESULTS ARE AS FOLLOWS:
Roanoke Valley data includes Botetourt, Craig, Roanoke City, and Salem Presentation by Susan Rieves-Austin
Roanoke Valley data includes Botetourt, Craig, Roanoke City, and Salem Presentation by Susan Rieves-Austin
Roanoke Valley data includes Botetourt, Craig, Roanoke City, and Salem Presentation by Susan Rieves-Austin
Roanoke Valley data includes Botetourt, Craig, Roanoke City, and Salem Presentation by Susan Rieves-Austin
Roanoke Valley data includes Botetourt, Craig, Roanoke City, and Salem Presentation by Susan Rieves-Austin