Download
1 / 42
430 likes | 646 Views
Probabilistic Risk Analysis of U.S. Climate Change Impacts Implications for Climate Policy. Benjamin L. Preston Pew Center on Global Climate Change Arlington, Virginia USA. Climate Change & Risk.

E N D
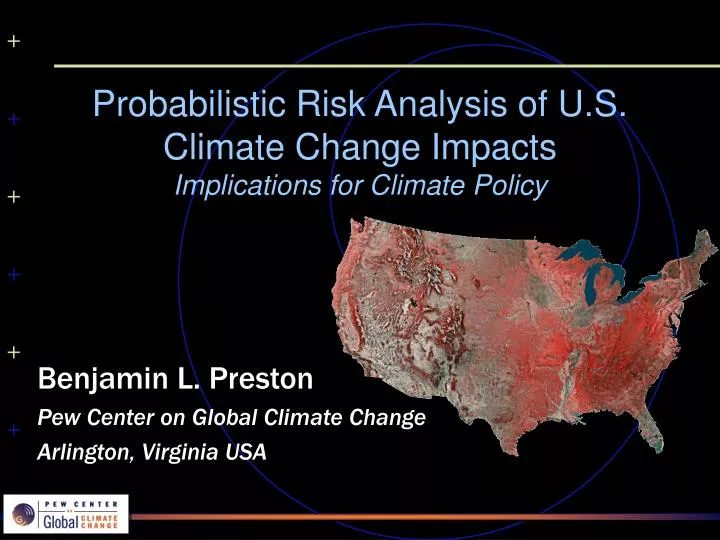
Probabilistic Risk Analysis of U.S. Climate Change ImpactsImplications for Climate Policy Benjamin L. Preston Pew Center on Global Climate Change Arlington, Virginia USA
Climate Change & Risk • Policy actions to address global climate change fundamentally represent risk management strategies • Mitigation – minimize future climate change • Adaptation – minimize damages from climate change • Effective risk management is aided by robust analysis of risk and its uncertainties • The risk of adverse impacts from climate change is a function of two factors (Jones, 2001): • The consequences of an adverse event (hazard) • The probability that an adverse event will occur (exposure)
Climate Change & Risk • Estimating the probability of an adverse event/effect: 1) Identify thresholds for adverse effects • Examples: O’Neill & Oppenheimer (2002); WBGU (2003) • Examined warming thresholds for impacts of concern • Sustainability of coral reef ecosystems • Collapse of Atlantic thermohaline circulation • Collapse of the West Antarctic Ice Sheet 2) Assess probability of future climate change • Examples: Wigley & Raper (2001); Webster et al. (2003) • Developed probability distributions for future global warming based upon uncertainties in emissions and climate sensitivity
Identify Management Goals Conduct Risk Analysis Identify Assessment Criteria Stakeholders Assess Sectoral Sensitivity Assess Climate Uncertainty Identify Sectoral Thresholds Risk Analysis Framework Based on Jones (2001)
Assess management options Mitigation Adaptation Identify Management Goals Conduct Risk Analysis Identify Assessment Criteria Stakeholders Assess Sectoral Sensitivity Assess Climate Uncertainty Identify Sectoral Thresholds Constrain future warming Increase resilience Based on Jones (2001)
Sectors/Impacts Considered • Agriculture (10) • Aquatic Biodiversity (24) • Coastal Communities (6) • Energy (6) • Extreme Events (7) • Forestry (8) • GDP (7) • Health (13) • Recreation Welfare (3) • Terrestrial Biodiversity (11) • Thermohaline Circulation (12) • Transportation (8) • Water Resources (9) • WAIS/GIS (10) • Wildfires (5) • Winter Recreation (8) ~(x) indicates number of studies available ~multiple thresholds available for some studies
Sectoral Sensitivity Analysis • For each sector, a sensitivity analysis was conducted • A threshold was calculated for each study available for a particular sector/impact, using common criteria • These estimates were integrated to yield a linear or log-linear probability distribution for sectoral sensitivity • Probability distributions were subsequently used to estimate sectoral thresholds • Threshold = 50th percentile (median) for sectoral sensitivity
Assessment Criteria • Market impacts – net decline in GDP, economic welfare, or increase in dollar damages relative to present or future baselines in the absence of climate change • Estimated by averaging between scenarios or utilizing the highest scenario that did not yield adverse effects (e.g., forestry and agriculture) • Biophysical Impacts – 10-20% change in biophysical parameter (e.g., productivity, area burned, water levels, etc.) • Scenarios yielding Impacts of magnitudes beyond this range were normalized to a 15% effect with a proportional reduction in the corresponding temperature change • Expert Judgment – reported sectoral thresholds based upon prior analyses, subjective/expert judgment
Market impacts threshold 10% 10% 20% 20% Biophysical impacts threshold Assessment Criteria
Example: Agriculture +7% precipitation
Median Sensitivity=5.4oC Example: Agriculture Probability distribution for agriculture
Median Sensitivity=1.4oC Example: Aquatic/Marine Biodiversity Probability distribution for aquatic biodiversity
Median Sensitivity=3.6oC Example: GDP Probability distribution for GDP
Median Sensitivity=2.2oC Example: Water Resources Probability distribution for water resources
Median Sensitivity=3.3oC Example: WAIS/GIS Probability distribution for WAIS/GIS
“Dangerous Interference” • Sectoral risks can be analyzed to estimate net U.S. climate sensitivity • These aggregate estimates may also be utilized as national climate thresholds, for the purposes of comparison or policy guidance • 50th percentile would provide an average level of protection across U.S. sectors/impacts • 10th percentile provides protection for the majority of sectors • But, are such estimates of any utility?
Median=2.9oC 10th=0.9oC U.S. Sensitivity & Net Thresholds Estimation of net U.S. climate sensitivity
Climate Uncertainty • Identifying the likelihood of exceeding sectoral/impact thresholds requires information on the probabilistic uncertainty of future climate change • Uncertainty in climate change projections originates from two primary sources: 1) Climate sensitivity • Represented by different climate models 2) Future emissions • Represented by different emissions scenarios
Climate Uncertainty • A probabilistic distribution for future coterminus U.S. temperature change was developed via ensemble climate modeling • MAGICC/SCENGEN climate model (v.4.1) • Simulated 2050 & 2100 temperature change for 17 different climate models • Simulations driven by 5 different emissions scenarios (IPCC SRES: B1, B2, A1B, A2, A1F1) • Results were used to model a cumulative probability distribution for future U.S. temperature change
Probability distributions for 2050 & 2100 (U.S.) USNA 2050 (0.8-2.5oC) USNA 2100 (1.4-5.6oC) IPCC 2050 (0.8-2.5oC) IPCC 2100 (1.4-5.6oC) Climate Uncertainty 2100 (1.8-6.3oC) Median=3.6oC 2050 (1.7-3.1oC) Median=2.2oC
Risk Analysis • Sectoral thresholds were subsequently compared with U.S. probability distributions for future temperature change • Pass/Fail Monte Carlo simulation (n=1000) • Resulted in a sector-specific probability of exceeding thresholds • Results for individual sectors were subsequently integrated to evaluate net U.S. risk
Sector-specific risk estimates (median thresholds) RiskAnalysis
Net National Risk 2.9oC Threshold 2050=7.5% 2100=72.7% 50th 0.9oC Threshold 2050=100% 2100=100% 10th Risk Analysis Net U.S. risk in 2050 & 2100
Uncertainty Analysis: Thresholds • Median sectoral sensitivity overlooks variation in the literature for individual sectors • Sources of variation • Differential assessment of adaptation • Assessment methodology • Geographic/temporal scale • Climate scenarios/models • Accounting for this variability increases the uncertainty associated with risk estimates
Risk in 2050: 5th-95th percentile sectoral thresholds Uncertainty Analysis: Thresholds
Uncertainty Analysis: Thresholds Risk in 2100: 5th-95th percentile sectoral thresholds
U.S. Risk Assessment • The current risk analysis indicates that considerable variation (e.g., 0-100%) exists in risk to individual sectors by 2050, while estimates of net U.S. risk are dependent upon how thresholds are defined (e.g., 10th vs. 50th percentile) • By 2100, risk is quite high on both a sectoral and net national basis • These estimates generally have poor incorporation of adaptation options, which may cause an exaggeration of risk (e.g., health) • Threshold uncertainty is the primary contributor to overall uncertainty in the risk analysis • Modifications to assessment criteria, better accounting for adaptation, and reduced threshold uncertainty would have a significant influence on risk for a number of sectors/impacts
Risk Reduction • CO2 mitigation represents a risk management strategy to reduce the likelihood of adverse climate change impacts • Use of WRE stabilization scenarios in MAGICC/SCENGEN results in revised probability distributions for U.S. warming:
Probability Distributions: Stabilization 2050 warming: Stabilization scenarios
Probability Distributions: Stabilization 2100 warming: Stabilization scenarios
Effects of CO2 stabilization on sectoral risk (2050) Risk Reduction from Stabilization
Risk Reduction from Stabilization Effects of CO2 stabilization on sectoral risk (2100)
Policy Implications • CO2 stabilization goals have differential effects on risk, depending upon sectoral sensitivity • Sensitive sectors are likely to experience adverse effects regardless of the stabilization target • For less sensitive sectors, risk is reduced significantly, even for higher stabilization targets • However, even if stabilization doesn’t reduce risk itself, it can still reduce the magnitude of the adverse effect • Additional risk reduction strategies are necessary (e.g., adaptation), and may provide additional protection for some sectors at relatively low cost
. . .but do they really help? ? “Dangerous Interference” Revisited • Thresholds can be used to identify optimal mitigation targets . . .
“Dangerous Interference” Revisited • Risk analysis can be used to pursue UNFCCC Article II definitions, and identify associated stabilization targets • However, aggregate estimates of dangerous climate change either neglect risk to sectors of concern or necessitate stringent stabilization targets that will be difficult to achieve: • 50th percentile – doesn’t protect more sensitive sectors • 10th percentile – invariably leads to stringent mitigation targets • Mitigation and adaptation decisions should be based upon consideration of management goals for individual sectors and regions and the most robust policies (mitigation and adaptation) for achieving those goals
Conclusions • Unmitigated climate change has a high probability of inducing adverse effects in a broad range of U.S. sectors • CO2 stabilization targets can provide significant risk reduction for some sectors, but for others, providing protection necessitates stabilization levels that are likely unrealistic and thus adaptation strategies are critical • Risk analysis can provide quantitative estimates of relative and absolute risk across sectors and regions, but aggregate estimates for “dangerous” climate change should be considered cautiously • Substantial progress on impact assessment is required to reduce threshold uncertainty and enhance capacity for risk-based approaches to climate management