Download
1 / 30
300 likes | 428 Views
National Integrated Drought Information System. Southeast US Pilot for Apalachicola-Flint-Chattahoochee River Basin 4 December 2012. Outline. Welcome – Keith Ingram, Southeast Climate Consortium, UF Current drought status and how we got here – David Zierden , Florida Climate Center, FSU

E N D
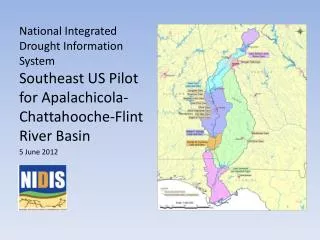
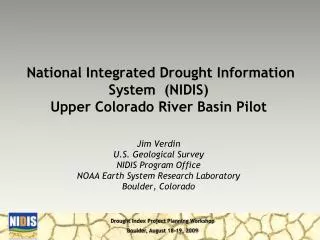
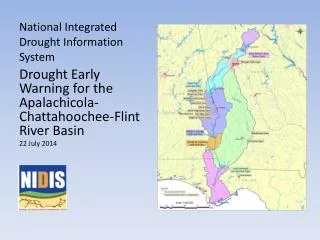
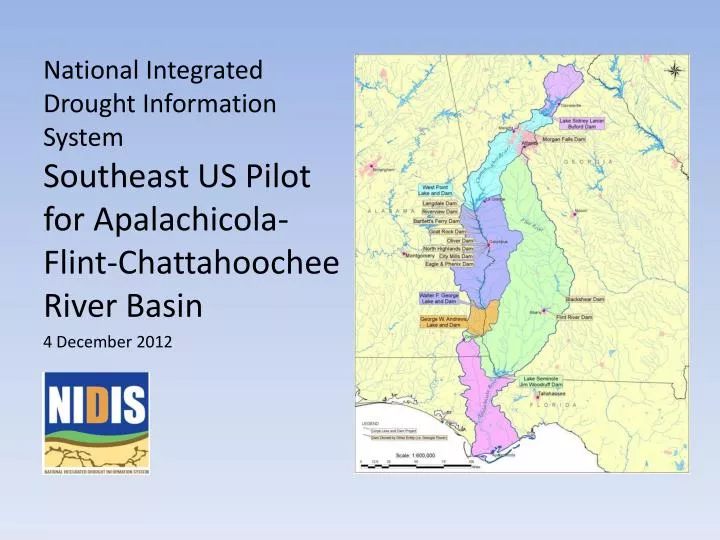
National Integrated Drought Information System Southeast US Pilot for Apalachicola-Flint-Chattahoochee River Basin 4 December 2012
Outline Welcome – Keith Ingram, Southeast Climate Consortium, UF Current drought status and how we got here – David Zierden, Florida Climate Center, FSU Streamflows and groundwater – Tony Gotvald, USGS Reservoir status and projections – Bailey Crane, US ACE Seasonal outlooks – David Zierden, FSU Streamflow forecasts – Jeff Dobur, SE River Forecast Center, NOAA Summary and Discussion – Keith Ingram, SECC
Current drought status from Drought Monitor http://www.drought.unl.edu/dm/monitor.html
Cumulative Rainfall Deficits Past 30 days Since Jan. 1 http://water.weather.gov/precip/
Realtime stream flow compared with historical monthly averages Current: Previous Brief: http://waterwatch.usgs.gov
Below Normal 7-day Average Streamflows Previous brief: Below normal 7-day average streamflowas compared with historical streamflow for day shown Current: http://waterwatch.usgs.gov
Lake Lanier Inflows Chestatee near Dahlonega (02333500) Chattahoochee near Cornelia (02331600) http://waterwatch.usgs.gov
Current Streamflows Chattahoochee at West Point (02339500) Flint at Bainbridge (02356000) http://waterwatch.usgs.gov
Streamflows Apalachicola at Chattahoochee (02358000) http://waterwatch.usgs.gov
Groundwater Status Miller County, GA (Upper Floridan Aquifer) http://groundwaterwatch.usgs.gov
5-Day Precipitation Forecast http://www.hpc.ncep.noaa.gov/qpf/day1-5.shtml
7-day average Pacific Ocean SST Anomalies http://www.cpc.ncep.noaa.gov/products/precip/CWlink/MJO/enso.shtml
1-3 Month Precipitation Outlook 3 Month 1 Month
1-Month Streamflow Forecasts Apalachicola Watershed Southeast River Forecast Center Lake Lanier Inflows November 30th – December 30th 2012 Whitesburg Lovejoy Above Normal Carsonville West Point Near Normal Columbus Below Normal Albany WF George Columbus Woodruff Blountstown
3-Month Mean Daily Streamflow Forecasts Apalachicola Watershed Southeast River Forecast Center Lake Lanier Inflows November 30th 2012 – February 30th 2013 Whitesburg Lovejoy Above Normal Carsonville West Point Near Normal Below Normal Columbus WF George Albany Columbus Woodruff Blountstown
Summary Drought conditions have spread througout the entire ACF with drought in the central part of the basin categorized as extreme to exceptional Similarly, streamflows are below average streamflows throughout the entire basin, though inflows to West Point are normal because of releases from Lake Lanier Ground water levels in S Georgia remain at historic low levels Basin inflows are about 1600 cfsbelow outflows, so reservoir levels have continued to decline, with Lake Lanier approaching the threshold for conservation zone 4
Summary The 5-day outlook is for less than 1 inch of precipitation in the northern half of the basin and no rain in the southern half ENSO conditions remain neutral, so a total of 3 to 6 inches of rainfall are expected for the basin in each month of December and January Streamflow forecasts at 1 and 3 months all suggest that drought conditions will persist or worsen
References Speakers David Zierden, FSU Tony Gotvald, USGS Bailey Crane, USACE Jeff Dobur, SERFC Moderator Keith Ingram, SECC Additional information • General drought information • http://drought.govhttp://www.drought.unl.edu • General climate and El Niño information http://agroclimate.org/climate/ • Streamflow monitoring & forecasting • http://waterwatch.usgs.gov • http://www.srh.noaa.gov/serfc/ • Groundwater monitoring • http://groundwaterwatch.usgs.gov
Thank you! Next briefing – 18December 2012, 1:00 pm EST Slides from this briefing will be posted at http://drought.gov/drought/content/regional-programs/regional-drought-webinars Please send comments and suggestions to: ktingram@ufl.edu