Download
1 / 29
300 likes | 794 Views
WTP Final Seismic Design Criteria - Presentation Outline

E N D
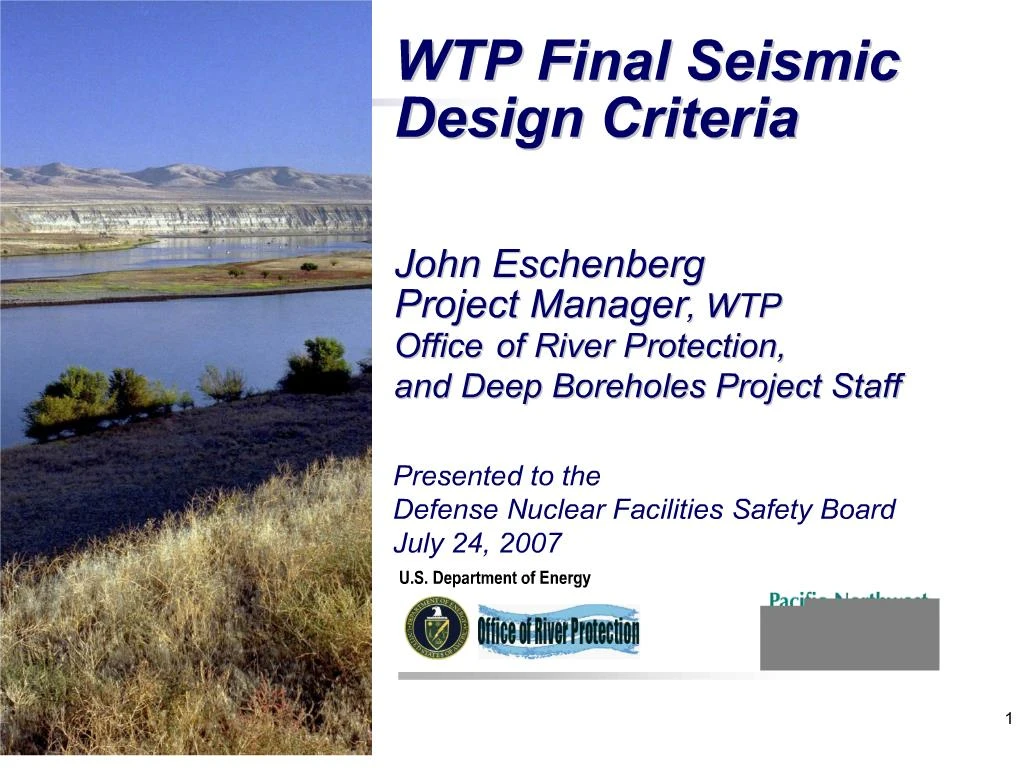
1. WTP Final Seismic Design Criteria
John Eschenberg
Project Manager, WTP
Office of River Protection,
and Deep Boreholes Project Staff
3. Purpose and Background Purpose
Update the DNFSB on the final WTP seismic design criteria
Background
Project seismic design basis ground motion and spectra issued in May 1999
Criteria revised in February 2005 to accommodate uncertainty in interbed velocity contrasts
Deep Boreholes Project initiated in 2005 to:
Obtain direct seismic velocity data and reduce this uncertainty
Revise the WTP seismic analyses and produce a final WTP site-specific ground motion design response spectra (WSGM)
4. Background (cont.) The horizontal ground motion design response spectrum for WTP developed in 2005 is shown in the graph to the right (RGM-2005)
The spectrum represents a �conservative envelope of the range of the mean results� DelDel
5. Deep Boreholes Project Fieldwork Drill three deep boreholes and one corehole adjacent to the WTP HLW and Pretreatment facilities
Collect subsurface velocity and geophysical data in-situ and on extracted core samples
Schedule and Cost
~14 months
~$18M 14 months from first drilling RFPs to final reports.14 months from first drilling RFPs to final reports.
7. Four steel-cased entry holes (9-5/8 in) to top of basalt
One wireline corehole (3-1/2 in) to 1400 ft
Three deep mud rotary boreholes
(7-7/8 in) to ~1400 ft through four interbeds
8. Geologic Characterization
9. Boreholes Data Collection
Geophysical Logging
The compensated density log tool contains a radioactive source (cesium-137) and two gamma detectors (near at 20 cm and far at 35 cm). The source and detectors are heavily shielded to prevent direct detection of gamma rays from the source. The principle is to focus gamma rays from the source into the formation, where they collide with electrons in the formation (Compton-scattering) and are reflected back to one of the CsI detectors. The response of the Density tool is determined essentially by the electron density (number of electrons per cubic centimeter) of the formation.
Neutron logs respond primarily to the amount of hydrogen present in the formation (i.e., water, H2O). Low hydrogen concentrations correlate to low porosity, and vice versa. High-energy (fast) neutrons from an americium-beryllium (AmBe) source collide with nuclei of the formation materials as elastic �billiard-ball� collisions. With each collision a neutron loses some of its energy. The greatest energy loss occurs in collisions with the hydrogen nucleus. Collisions with heavy nuclei do not slow the neutron down very much. Thus, the slowing-down of neutrons depends largely on the amount of hydrogen in the formation.
Induction logging devices transmit high-frequency alternating current of constant intensity through the transmitter coil and output �EM conductivity� in millisiemens per meter. The alternating magnetic field induces secondary currents in the formation. These currents flow in circular ground-loop paths coaxial with the transmitter coil. The ground-loop currents, in turn, create magnetic fields, which induce signals in the receiver coil. The receiver signals are essentially proportional to the conductivity of the formation.
The Full Waveform Sonic log record the full waveform for 1,024�milliseconds at an interval of one microsecond. The recording begins at a delay of 56 milliseconds after the transmitted pulse. Borehole fluid is required for the tool to function properly. The first arrival (shortest travel time) of the acoustic pulse is through the shortest distance to the borehole wall, then through the formation rock matrix to the receiver. The near and far receivers show changes in the acoustic properties of the formation matrix and are also affected by hole size conditions (washed-out zones).
The Acoustic Televiewer logging sonde is designed to generate an image of the borehole wall by transmitting ultrasonic pulses from a rotating sensor and then recording the amplitude and travel time of the signal that reflects at the interface between the borehole fluid and formation (i.e., borehole wall).
10. Initiated drilling 6/12/06
All three boreholes and corehole drilled to depth 10/12/06
Suspension (p-s) logging completed 10/17/06
Geophysical logging completed 10/28/06
Gravity-density logging completed 12/11/06
Deep downhole seismic logging completed 12/20/06
Shallow sediment logging completed 2/09/07 after casing Hanford and Ringold formations
11. Downhole Logging
12. Velocity Data Velocity data collected using an impulsive seismic source in suprabasalt sediments and upper two basalt and interbed units
Data from three boreholes comparable
13. Downhole Signals
14. Velocity Data Velocity data collected using a vibratory seismic source in the basalt and interbed units
Data from three boreholes comparable
15. Velocity Models Suprabasalt sediments
Integrated and averaged new borehole Vs data with prior seismic cone penetrometer and downhole data
Used geologists� logs to define range of geologic unit thicknesses
Basalts and interbeds
Integrated and averaged Texas (vibratory) and Redpath (impulsive) new borehole Vs data
Used density and suspension logging Vs data to develop model to represent the change in velocity within each basalt flow top
Used geologists� logs and geophysical data to define range of geologic unit thicknesses Geologists� logs in both locations on slide.Geologists� logs in both locations on slide.
16. Velocity Models - Sediments 2007 models are comparable to 2005 except:
Sharp Vs contrast from Hanford sand to gravel (H2/H3)
Sharp Vs contrast from Cold Creek Unit to lower Ringold Unit A
High Vs in Ringold Unit A comparable to Vs in basalt flow top
Near-surface, in-site sediment Vs to base of foundation - no backfill
Sharp Vs contrast from Hanford Sand (H2) to Hanford Gravel (H3)
Sharp Vs contrast from Cold Creek Unit (CCU) gravel ("reworked" Ringold) to lower Ringold Unit A
Vs in CCU gravel possibly lower than in overlying H3 gravels
High Vs in lower Ringold compares to Vs in basalt flow topNear-surface, in-site sediment Vs to base of foundation - no backfill
Sharp Vs contrast from Hanford Sand (H2) to Hanford Gravel (H3)
Sharp Vs contrast from Cold Creek Unit (CCU) gravel ("reworked" Ringold) to lower Ringold Unit A
Vs in CCU gravel possibly lower than in overlying H3 gravels
High Vs in lower Ringold compares to Vs in basalt flow top
17. Velocity Models � Basalts/Interbeds 2007 models reflect greater Vs contrasts between basalts and interbeds
Vs basalts near 2005 high-range estimate
Vs interbeds near 2005 low-range estimate
Basalt flow top gradients
individually measured
thinner and stronger
Includes internal flow structures
Individual unit and composite Vs alternative models used in final analyses Rock-Soil velocity contrast elevated due to high Vs in Ringold Unit A
New basalt Vs near previous high-range estimate
New interbed Vs near previous low-range estimate
New basalt flow top gradient zones thinner and stronger, individually measured
Flow top Vs gradient measured for Priest Rapids basalt and additional internal flow structuresRock-Soil velocity contrast elevated due to high Vs in Ringold Unit A
New basalt Vs near previous high-range estimate
New interbed Vs near previous low-range estimate
New basalt flow top gradient zones thinner and stronger, individually measured
Flow top Vs gradient measured for Priest Rapids basalt and additional internal flow structures
18. Density Models Density measured using downhole gamma-gamma, and borehole gravity:
No density measurements in Hanford sand/gravel and Ringold Unit due to steel casing
Good agreement between gamma-gamma and borehole gravity
Near-surface, in-site sediment Vs to base of foundation - no backfill
Sharp Vs contrast from Hanford Sand (H2) to Hanford Gravel (H3)
Sharp Vs contrast from Cold Creek Unit (CCU) gravel ("reworked" Ringold) to lower Ringold Unit A
Vs in CCU gravel possibly lower than in overlying H3 gravels
High Vs in lower Ringold compares to Vs in basalt flow topNear-surface, in-site sediment Vs to base of foundation - no backfill
Sharp Vs contrast from Hanford Sand (H2) to Hanford Gravel (H3)
Sharp Vs contrast from Cold Creek Unit (CCU) gravel ("reworked" Ringold) to lower Ringold Unit A
Vs in CCU gravel possibly lower than in overlying H3 gravels
High Vs in lower Ringold compares to Vs in basalt flow top
19. Logic Tree - 2005 Lack of Vs data for basalts and interbeds led to smaller velocity contrasts and higher probability of increased ground motion
20. Logic Tree - 2007 Uncertainty in Vs significantly reduced with site data
New sediment data reflects greater damping � added site-specific soil curves
21. Inputs to Site Response Analyses and Relative Uncertainties and Impact
22. 2005 Site Response Wide range of Vs alternatives for basalts and interbeds had greatest impact on site response
23. 2007 Site Response Lower uncertainty and greater Vs contrasts result in lower relative amplification
24. Summary of Key 2005-2007 Model Differences Basalt and interbed Vs
Significantly smaller uncertainty of median Vs
Significantly greater contrast between basalts and interbeds
Sediment dynamic properties
More non-linear and greater damping based on site-specific data
Wider range of alternatives
25. Derivation of RGM - 2005 RGM-2005 design response spectra (DRS) developed using 84th percentile relative amplification function (RAF)
Increased peak horizontal ground motion by up to 40% over original design criteria
26. Derivation of WSGM - 2007 WSGM-2007 design response spectra developed using new 84th percentile relative amplification function
Decreased peak horizontal ground motion by ~25% from 2005
27. Future Plans Secretarial Certification of Final Criteria
Restart Construction of PT and HLW
PT and HLW Structural Summary Reports to be issued December 2007
One year backlog between design and construction
Use of final seismic criteria (WSGM-2007) limited
28. Aerial View of WTP Site
29. Reports of the Deep Boreholes Project