Download
1 / 5
240 likes | 762 Views
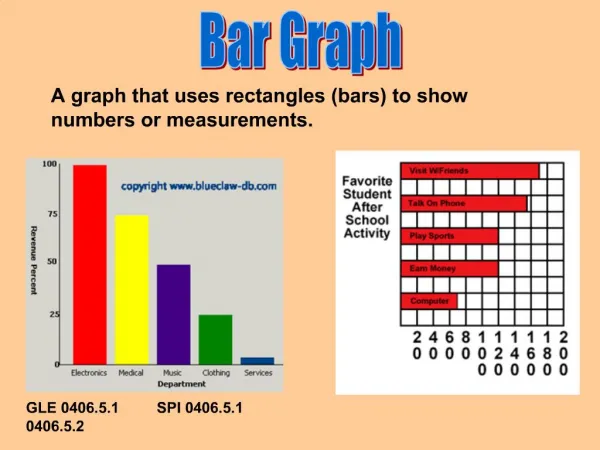
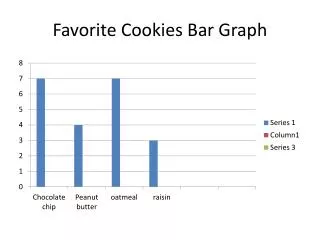
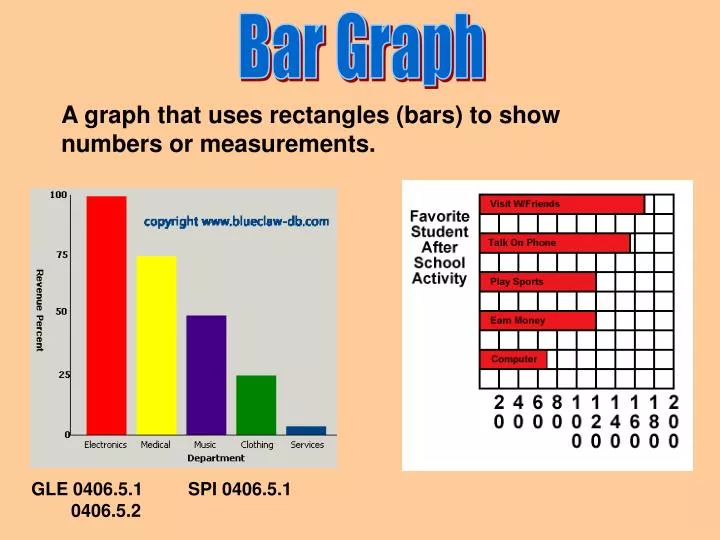
Bar Graph. A graph that uses rectangles (bars) to show numbers or measurements. GLE 0406.5.1 SPI 0406.5.1 0406.5.2. Parts of a bar graph.

E N D
Bar Graph A graph that uses rectangles (bars) to show numbers or measurements. GLE 0406.5.1 SPI 0406.5.1 0406.5.2
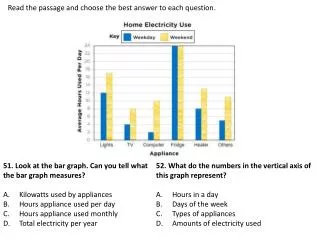
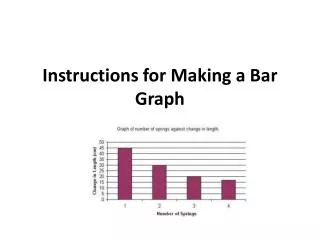
Parts of a bar graph. Bar graphs are an excellent way to show results that happen one time. It is an easy comparison tool for surveys, inventories, and this type of data. The bar graph is marked off with a series of lines called grid lines. Bar graphs can be horizontal or vertical. Both kinds will have two axes. One axis gives the frequency information and the other axis gives the group data. Bar graphs must also have a title and labels on the axes.
Frequency of the data, numbered in 10’s. This axis gives the group data.
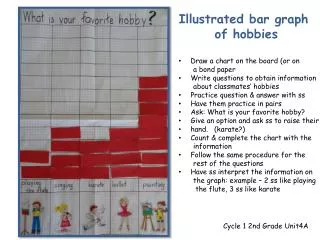
Activity Example Favorite Subjects in our Class Gather data to determine which subject is the favorite amongst your classmates, or school. The total number of responses will affect the size of your bars. Determine what the frequency numbers will need to be from the responses. This graph represents 30 responses. 5 liked Science, 4 liked reading, 6 liked math, 3 liked English, 7 liked spelling and 5 liked Social Studies. It is easy to see the spelling is the favorite subject while English is the least favorite.
Additional Activities and Resources http://nces.ed.gov/nceskids/createAgraph/default.aspx http://www.shodor.org/interactivate/activities/barGraph/ http://www.teach-nology.com/teachers/lesson_plans/math/graphing/ http://www.lessonplanspage.com/MathCentimeterHatSizeMeasurementProblemSolvingBarGraph35.htm http://www.crayola.com/lesson-plans/detail/big-foot-bar-graph-lesson-plan/ http://curricula-by-grade.suite101.com/article.cfm/elementary_recipe_math_lesson_plan http://www.learnnc.org/lp/pages/3898 http://www.learnnc.org/lp/pages/3265