Download

1 / 7
340 likes | 958 Views
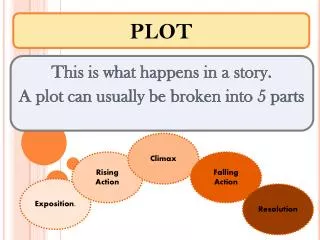
Line Plot. Definition & Practice. Line Plot. A line plot shows the spread of all the data on a number line. Easily identifies the mode. All line plots include: - a title - a horizontal line - data displayed by use of X’s.

E N D
Line Plot Definition & Practice
Line Plot • A line plot shows the spread of all the data on a number line. • Easily identifies the mode. • All line plots include: - a title - a horizontal line - data displayed by use of X’s
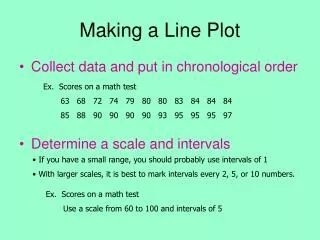
Line PlotMethod of drawing a line plot • If numbers are used: Order the values from least to greatest. (Note: some numbers may repeat). • If words are used: place data into categories. • Draw a number line and label with the values/categories above (only use repeated numbers/category once). • Plot the values of each item on a number line by placing an X above the value which it corresponds. • Continue to plot the values until all data is used. Repeated numbers: the X is placed vertically above the previous X. (See example next slide).
Line Plot Example: Favorite Colors X X X X X X X X X X X X X X X X X X X Red Blue Green Yellow Purple
Line Plot Example: The following data set shows the hourly rates of different workers, in dollars. (10, 12, 8, 9, 10, 10, 9, 8, 12, 12, 10, 40, 12,10, 8, 11) Draw a line plot . X X X X X X X X X X X X X X X X 8 9 10 11 12 40
Line Plot Practice Draw a Line Plot. • Students scored the following on their test: • 99, 82, 78, 85, 98, 82, 85, 78, 98, 82 • Draw a line plot. • 2. Over 3 years several dogs had litters of puppies. Draw a line plot showing the number of puppies born. • 8, 2, 4, 4, 6, 2, 1, 4, 6, 2
Line Plot Practice Draw a Line Plot. • Students were asked their favorite subject in Elementary school. Draw a line plot of the results. • PE, PE, Math, Science, PE, Art, Music, Art, Math, PE, PE, Science, PE, Science • 2. A group of First Graders were asked to name their favorite pet. Draw a line plot of their responses. • Dog, Hamster, Dog, Dog, Cat, Pony, Dog, Cat, Dog, Snake, Dog