Download
1 / 7
70 likes | 167 Views
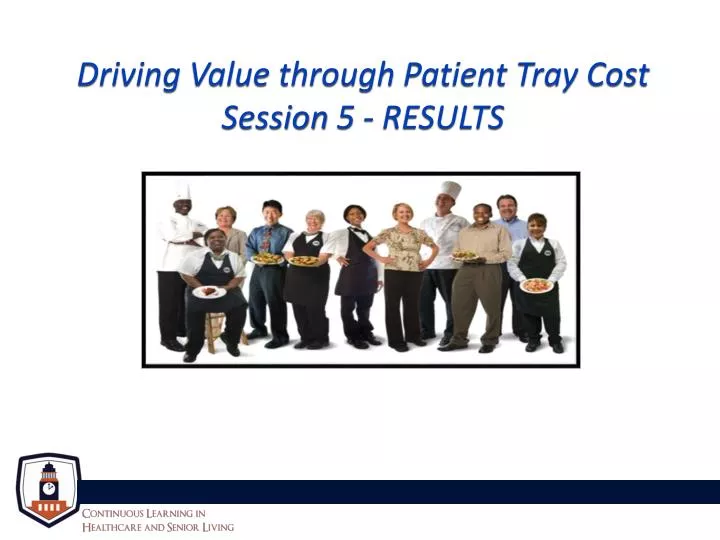
Driving Value through Patient Tray Cost Session 5 - RESULTS. Objectives . Congratulations Results from Trash Dish Room Audit Results from Tracking Trays Non- Deliverables Food Cost Percentage Next steps. CONGRATULATIONS!!. All of You that Continue to Participate. Trash Dish Room Audit.

E N D
Driving Value through Patient Tray Cost Session 5 - RESULTS
Objectives • Congratulations • Results from Trash Dish Room Audit • Results from Tracking Trays • Non- Deliverables • Food Cost Percentage • Next steps
CONGRATULATIONS!! All of You that Continue to Participate
Trash Dish Room Audit • Accounts findings varied from $0 - $84,447 annualized • 17 Accounts found Items that should not have been in the Trash • Average annualized savings - $2,761.57 • Average $2762 ( 17 accounts finding waste and removed $84,447 account)
Non-Deliverable Trays • Beginning of tracking = 1.37% Non-deliverable trays • End of tracking = .97% Non-deliverable trays • So What? • 17 accounts = $24,200 reduction in food cost • Average $1423 per account per year
Food Cost Percentage • P8 = 41.8% • P12 = 40.3% • So What? • Equals $77K reduction in food cost for P12
Next Steps • Continue to Keep a Tray Tracking Log • Must log categories of trays • Census and Non Census patients • Must log Now trays and Non-Deliverable trays • Conduct random Trash Dish Room Audits at least quarterly • Continue to have teaching moments with staff to create accountability of products