Download

1 / 31
310 likes | 442 Views
A Comparative Study of Energy Forms Used by the G-8 Between the Years 1980-2006. Team Members. Brandi Brehon, ECSU April Harry, Xavier Kenneth Joyner, ECSU Martin Arienmughare, Lincoln Kaiem Frink, ECSU Dr. Andrea Lawrence (Mentor), Spelman. Abstract.

E N D
A Comparative Study of Energy Forms Used by the G-8 Between the Years 1980-2006
Team Members • Brandi Brehon, ECSU • April Harry, Xavier • Kenneth Joyner, ECSU • Martin Arienmughare, Lincoln • Kaiem Frink, ECSU • Dr. Andrea Lawrence (Mentor), Spelman
Abstract The objective for the 2007 Elizabeth City State University-National Association of Mathematicians Computational Science and Scientific Visualization Summer Institute research project is to compare the various major types of energy sources used by the G-8 countries—Canada, France, Germany, Italy, Japan, Russia, United Kingdom, and United States—with the assistance of data for the years 1980-2006 from reliable online resources.
Abstract, cont. Comparisons will determine specifically what types of energy sources used by these countries and any concerns that they may produce (environmental or otherwise). This project will evaluate uses of energy for each G-8 country by using regression analysis to predict the energy consumption for each country in 2010. Lines of Regression will be displayed by graphs created in Minitab and MathCAD. Ultimately, we intend to conclude that the consumption of energy for each country will increase by the year 2010.
What is the G8? • The Group of Eight, also known as G8, is an international forum for the governments of Canada, France, Germany, Italy, Japan, Russia, the United Kingdom and the United States. Together, the eight countries represent about 65 percent of the world economy. The group's activities include year-round conferences and policy research, culminating with an annual summit meeting attended by the heads of government of the member states. The eight countries making up the G8 represent about 14 percent of the
The G8, cont. world population, and they account for nearly two thirds of the world's economic output measured by gross domestic product.
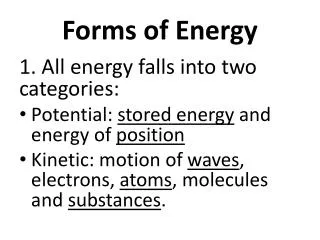
Energy Forms • This project compares each of the G8 country's consumptions of: • Oil • Natural Gas • Coal • Nuclear power • Hydropower • Other Renewables
The World Primary Energy Consumption (1980-2004) Data Table provided by the Department of Energy was utilized to calculate the estimated amount of energy each G-8 country will consume in the year 2010.
Figure 9. World Primary Energy Consumption Data Table (1980-2004)
Using Minitab, a table of each country’s energy consumption from 1980 to 2006 was created. The following data analysis for Japan is displayed as an example of how each country’s energy consumption data was utilized by Minitab.
We then used the “Fitted Line Plot” feature to produce the following graph, which shows the linear trend in Japan’s energy consumption:
Our statistical information for Japan’s primary energy consumption from 1980-2004, as calculated by Minitab, is as follows:
Predicting Japan’s energy consumption, given that the trend found in past data continues, is now a matter of substituting for the year in question for the variable x in the regression equation. We used Maple to do this: So, given that past trends continue, Japan is expected to consume 26.3 quadrillion Btus of energy in 2010.
This process was repeated for the other seven countries, producing the following results:
Figure 10. Projected Energy Consumption Using Regression Analysis for Year 2010 Projected Energy Consumption Using Regression Analysis for Year 2010
We then graphed all these lines of regression simultaneously in order to compare them, and draw conclusions about future energy consumption throughout the world.
Conclusion Every G-8 country –Japan, Russia, United Kingdom, Germany, France, United States, Canada, and Italy –has different energy sources that are utilized for domestic and industrial energy consumption. Each country’s energy consumption is estimated to increase by the year 2010. However, some countries have significant increases in energy consumption, in contrast other countries increased at a smaller rate. The actual cause for the increase in energy consumption was not investigated. Russia, Japan, and the United States have the highest percentage of annual increases. The increasing populations of these three countries may play a huge role in the predicted increases.
Future Research Future research should contain additional math modeling techniques. The models should include population, pollution, costs, and availability as factors in the increase in energy consumption. It is with sincerity that we hope the DoE will use this additional data analysis to explore our concerns.
Acknowledgements We would first like to acknowledge Dr. Johnny L. Houston for giving us the opportunity to complete this research as participating students of the 2007 ECSU-NAM Summer Research Institute and for being an informative mentor. Special thanks are given to Dr. Andrea Lawrence for being an enlightening mentor, as well as, the Department of Energy for providing the necessary information needed for our research. Acknowledgements are also given to the 2007 Summer Institute faculty, staff, and fellow student researchers.
References (more detailed citations found in technical report) • www.eia.doe.gov • http://globalis.gvu.unu.edu • http://en.wikipedia.org/wiki • http://www.cslforum.org/ • http://energytrends.pnl.gov/