Download
1 / 88
880 likes | 1.01k Views
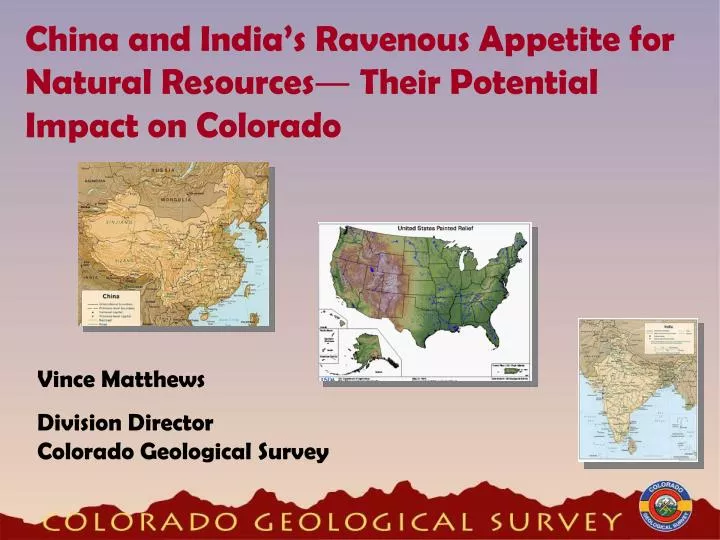
China and India’s Ravenous Appetite for Natural Resources ― Their Potential Impact on Colorado. Vince Matthews Division Director Colorado Geological Survey. Everything you need to know about Mineral and Energy in Colorado.

E N D
China and India’s Ravenous Appetite for Natural Resources― Their Potential Impact on Colorado Vince Matthews Division Director Colorado Geological Survey
Everything you need to know about Mineral and Energy in Colorado
Production of Natural Resources is an Important Part of Colorado’s Economy $11.8 billion Until a decade ago, the value of Colorado’s mineral and mineral fuel production was running around $2 billion per year.
Revenue comparison of Colorado’s Important Economic Sectors Minerals & Energy $ Billion Tourism Agriculture
Distribution of Colorado Mineral & Energy Revenues 2005 ($ Billions) Uranium 0.007 Coal 0.8 Minerals 1.5 1.2 Oil 8.1 Natural Gas CO2(0.200)
1800s copper mine in western Colorado 1902 discovery well for Boulder Oil Field Production of Natural Resources has Always been an Important Part of Colorado’s Economy
Boulder 1902 Just off 51st Street
China India U.S.
Population Comparison China India U.S.
China and India’s human resources are driving the explosive consumption of natural resources “All the years of socialism and controls had taken us downhill to the point where we had only $1 billion in foreign currency. Today we have $118 billion. We went from quiet self confidence to outrageous ambition in a decade.”--Tarun Das, Confederation of Indian Industry “I’ve taken a lot of people to Dalian, and they are amazed at how fast the economy is growing in this high-tech area. Americans don’t realize the challenge to the extent that they should.” --Win Liu, Director of U.S./EU projects
Land Area Comparison China U.S. India
GDP Comparison U.S. China India
GDP Growth Comparison China India U.S.
GDP Growth Comparison Japan GDP China GDP 13X 26X China’s economy has grown much more rapidly than Japan’s did during a similar 25 year period of rapid economic growth.
China’s Share of World Mineral Production in 2003 China ranks in the top three of the world’s producers of 15 strategic raw materials. Yet, that is not enough to supply their needs For instance, they are the # 2 copper producer in the world, but they still need to import 43% to fill their consumptive demand. Source: USGS, Kenzie, et al
Today, demand outstrips supply. Internal supply met demand until the end of the 20th century. 43% Imported! China’s Production and Consumption of Copper Production supplemented by imports Source: USGS, Kenzie, et al
China’s Share of World Mineral Production in 2003 China is the world’s #1 producer of iron ore. Again, internal supply met demand until the end of the 20th century. Source: USGS, Kenzie, et al
Today, China has also become the #1 importer of iron ore in the world. Leading Importers of Iron Ore—1980–2003 Sources: U.S. Geological Survey Minerals Yearbook; United Nations Conference on Trade and Development.
China’s growth in iron ore consumption in 2005 equaled ½ of the total U.S. production
Trends in Demand for Steel Demand for iron ore is driven by the demand for steel. Source: International Iron and Steel Institute.
World Energy Consumption Hydro
OIL CONSUMPTION- China Source: BP
China’s internal oil production was sufficient to supply her needs until the mid 90s. Today, 49% Imported! Source: Wood McKenzie
OIL- CONSUMPTION India 69% Imported! Source: BP
OIL- U.S. Production U.S. oil production peaked in 1970. Prudhoe Bay helped lessen the decline. Today we are producing 1.5 billion barrels per year less than in 1970. Today, 67% imported! Source: BP
For 20+ years world consumption stayed within an 8-10 million barrel per day range. In 1995 the world’s demand broke out of that narrow band. In the last two years, world demand increased 4.5 million barrels of oil per day.
Peak U.S. Oil Production Russia’s decline dropped precipitously when they stopped exploring and developing U.S. must be actively drilling and developing our reserves in order to prevent a more precipitous decline. The giant Prudhoe Bay discovery was important to slow our decline. Former Soviet Union Oil Production U.S. Oil Production In 1956, M. King Hubbert Predicted that Lower-48 Productionwould Begin Declining in 1969. In 1956, M. King Hubbert Predicted that Lower-48 Productionwould Begin Declining in 1969.
In 1969, M. King Hubbert Predicted that World Productionwould Begin Declining in 2000.
OIL Price $70.85 Late- August $75.12 This Spring
Wattenberg oil well near Longmont Wattenberg is the 26th largest oil field in the United States including Alaska and the Gulf of Mexico.
Colorado Oil Production Colorado Impact Oil prices increased 186% since 2002 Colorado’s production decline reversed in the last 5 years Wattenburg is the largest oil field west of the Mississippi (outside of CA and TX). Rangely still has large reserves (57R/65P). Commerce City refinery will be processing Canadian oil sands.
The Mahogany Zone in the Roan Cliffs above Rifle, CO. Oil shale is being seriously re-appraised.
Colorado has the richest, thickest oil shale resources in the world.
World Energy Consumption Natural Gas
NATURAL GAS CONSUMPTION - U.S. Natural gas consumption increased strongly from 1986 until ’96 as gas fired electrical generating plants were built. Consumption leveled off in the last decade which is a good thing because . . .
Natural Gas- U.S. (Production) Natural gas production peaked in the U.S. in 1973. 82% Today we are only capable of producing 82% of that peak.
NATURAL GAS- U.S. . . . imports were necessary to fill the increasing demand.
NATURAL GAS- U.S. Price $9.98 Mid- August The price reached $15.50 in December, but dropped back because of mild weather in the northeastern U.S.
All of the U.S. gas producing basins in the U.S. (below the dashed line) are in decline except for the Rockies (CO, WY, NM, UT). If gas production in the U.S. is to just remain flat for the next eight years, then the Rockies must fill the gap for the other declining basins
Colorado has all, or parts, of seven of the top 50 natural gas fields in the nation! Four of the top 50 gas fields in the United States are located along I-70 below the Roan Cliffs
Colorado Drilling Rigs 100 90 80 74 70 64 60 50 39 40 32 28 30 18 20 13 13 10 0 1998 1999 2000 2001 2002 2003 2004 2005 Today
Location of the 60,000+ wells drilled for oil & gas in Colorado.