Download
1 / 25
250 likes | 424 Views
Monitoring the Grid at local, national, and Global levels. Pete Gronbech GridPP Project Manager ACAT - Brunel Sept 2011. Introduction to GridPP Local Site Monitoring UK Regional Monitoring Global Monitoring Combined Dashboards. Hierarchy of the Grid.

E N D
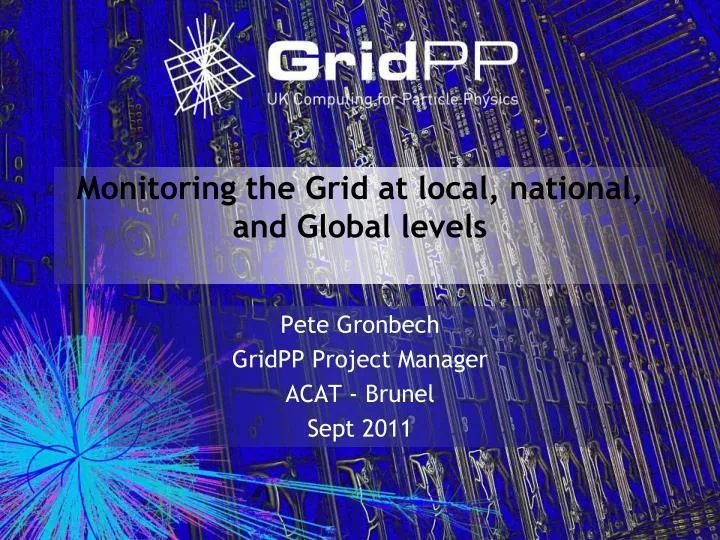
Monitoring the Grid at local, national, and Global levels Pete Gronbech GridPP Project Manager ACAT - Brunel Sept 2011
Introduction to GridPP • Local Site Monitoring • UK Regional Monitoring • Global Monitoring • Combined Dashboards
Hierarchy of the Grid GridPP provides the UK Particle Physics Grid, 17 University sites and the Rutherford Appleton Lab Tier 1 centre Part of the Worldwide Large Hadron Collider Computing Grid (WLCG) Tier 0 Tier 1 Tier 2 Tier 3 Local Sites CERN National Centres Sites GridPP provides ~28000 CPU cores WLCG provides ~234000 CPU cores
Site Monitoring - Ganglia • Sites consist of various front end servers, a batch system providing compute and storage servers • Most commonly monitored using Ganglia, which is a simple to install tool used for monitoring the status of nodes.
PBSWEBMON • In addition, tools to monitor the specific batch system may be used. Torque (formerly known as PBS) with the Maui scheduler is the predominant batch system used at the UK sites. Pbswebmon can be used to monitor this.
Network • Actual Traffic rates are monitored at many sites using Cacti. • Cluster network traffic between WN’s and storage for example can be seen on the Ganglia plots. • The GridPP developed GRIDMON to measure network capacity. • Each site had an identical node which could run a matrix of tests between sites to monitor bandwidth capacities and quality • A database and web front end provided the ability to get historical plots which aid problem diagnosis at sites.
dl lancs dur liv ed rl shef man gla Gridmon: Test Topology “Full mesh” testing does not scale: • As you add hosts it becomes more and more difficult to avoid contention between tests • In this particular case, LHC aids us by using a topology of a central star and several mini-meshes for its data flows • Each site only tests to/from the Tier-1 and other sites within their Tier-2 • A combination of ping, iperf, udpmon and traceroute is used.
Fabric Monitoring • Is a system up • Has it run out of disk space • Has a particular process stopped • Security logging, and patch status (pakiti) • Central Sys logger can help with scanning logs, can be automated with Swatch • Nagios provides a framework to schedule tests against nodes and inform you if there is a problem. Far Better than having to trawl logs trying to spot if ‘it’s not OK’. So although there is a web interface, it’s most useful to configure Nagios to send email or SMS alerts when problems occur.
UK Wide Testing • Steve Lloyds tests – Collection of global and local tests for the UK sites
Grid Service Monitoring • Regional Service Availability Monitoring • Each region (eg UK) has a system that tests the various grid components at the sites. This is also based on Nagios, the system queries the GOCDB to build up a list of services provided by the sites and then tests them. • The results are displayed on the web interfaceand the MyEGI portal but more importantly sent via ActiveMQ to a message bus where the Regional Dashboard picks them up. • Critical Failures will generate Alarms, which a team of Operators (Regional Operator on Duty or ROD), will use to assign tickets to the site. Sites are duty bound by EGI/WLCG MoUs to respond to these tickets within certain time scales dependant on Tier status.
GridPPnagios Views The UK regional nagios service is run by Oxford University
Operations Portal • https://operations-portal.in2p3.fr/dashboard
GSTAT – Information publishing • Information published by LDAP from the site BDII’s
Experimental Dashboards • Large VO’s such as Atlas, CMS, LHCb have their own extensive monitoring systems • These monitor the jobs and the success/ failure at sites
Global Accounting • http://www3.egee.cesga.es/gridsite/accounting/CESGA/tier2_view.html
Site Dashboards • Attempt to bring together the most relevant information from several web pages and display on one page. • Some times done by screen scraping. • Others use a Programmatic Interface to select specific information.
Site Dashboards • RAL Tier 1
Oxford / Glasgow Site dashboards Thanks to Glasgow for the idea / code
Conclusions • Probably too much information to ever fit on one dashboard • Systems Administrators will continue to need multiple screens to keep track of many web pages • They will have to try to consolidate these with customized dashboards, Or perhaps ...
References • GridPP http://www.gridpp.ac.uk/ • WLCG http://lcg.web.cern.ch/lcg/ • Ganglia http://ganglia.sourceforge.net/ • Pbswebmonhttp://sourceforge.net/apps/trac/pbswebmon/wiki • Cacti http://www.cacti.net/ , pakitihttp://pakiti.sourceforge.net/ , Nagios http://www.nagios.org/ , swatch http://sourceforge.net/projects/swatch/ • Gridmonhttp://gridmon.dl.ac.uk/gridmon/graph.html • Steve Lloyd tests http://pprc.qmul.ac.uk/~lloyd/gridpp/ukgrid.html • GridPPnagioshttps://gridppnagios.physics.ox.ac.uk/nagios/ (WLCG Nagios SAM equivalent tests) reporting to Central Operational Dashboard https://operations-portal.egi.eu/dashboard , and MyEGIhttps://gridppnagios.physics.ox.ac.uk/myegi • EGI Levels • GOCDB http://goc.egi.eu/ • APEL http://www3.egee.cesga.es/gridsite/accounting/CESGA/egee_view.html , Experimental SAM/ Dashboards, (eg Atlas dashboard http://dashboard.cern.ch/atlas/) , Experiment based Nagioshttps://sam-atlas.cern.ch/nagios/ • GSTAT http://gstat-prod.cern.ch/gstat/summary/GRID/GRIDPP/ / WLCG REBUS http://gstat-wlcg.cern.ch/apps/capacities/vo_shares/