Download
1 / 12
130 likes | 326 Views
Adequate Yearly Progress. AYP. No Child Left Behind [NCLB]. Reauthorization of the Improving America’s Schools Act Will require testing in Language Arts and Math for all students in grades 3-8 Requires all students to score in the Proficient range by 2014

E N D
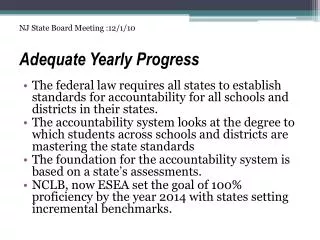
No Child Left Behind [NCLB] Reauthorization of the Improving America’s Schools Act Will require testing in Language Arts and Math for all students in grades 3-8 Requires all students to score in the Proficient range by 2014 Requires schools, districts, & states to be rated Measures progress using a Proficiency Index
MCAS • MCAS is the assessment instrument used in Massachusetts to implement NCLB • The Proficient category is represented by a score of 240--------much higher than the passing score of 220
NCLB • A new standard: Proficient [240 & above] • A new measure: Proficiency Index
Proficiency Index measures how close a school is to having all students score in the Proficient/Advanced categories [240-280] Advanced 260 100 points Proficient Target For AllStudents 240 [230-238] 75 points Needs Improvement [220-228] 50 points 220 [210-218] 25 points Failing/Warning [200-208] 0 points 200
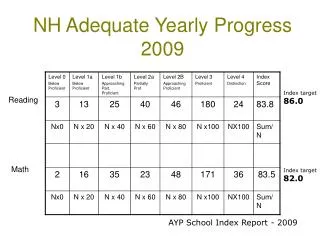
AYP Determination Factors A. Participation Rate B. Performance Relative to State Targets C. Improvement during Cycle D. Additional Indicator Cycle III Targets 95% or greater ELA 75.6 Math 60.8 100 – baseline 6 Rate of attendance 92% or improvement of 1% Grade 12 competency determination rate of 70%
AYP Determination Factors A. Participation Rate B. Performance Relative to State Targets C. Improvement during Cycle D. Additional Indicator Cycle III Targets 95% or greater ELA 75.6 Math 60.8 100 – 52 = 8 points 6 Rate of attendance 92% or improvement of 1% Grade 12 competency determination rate of 70%
AYP Flow Chart A. Participation 95 % Yes No State Level [ELA 75.6] [Math 60.8] B. Performance Yes No C. Improvement Your target 8 points Yes No D. Additional Indicator Attendance or CD rate Yes No Did Not Make AYP Made AYP
AYP Flow Chart A. Participation Yes on A + B = AYP or Yes on A + C + D Yes No B. Performance Yes No C. Improvement Yes No D. Additional Indicator Yes No Did Not Make AYP Made AYP
Schedule of Ratings • Fall, 2004 • Every two years [2006, 2008, 2010, 2012, 2014] • Ratings will for total school population, as well as major subgroups [LEP; SPED; Reduced Lunch; Racial Categories]
Sanctions based on Failure to Make AYP • Fail to make AYP in 2 consecutive years SINI • SINI School choice School Improvement Plan Targeted Technical Assistance • Fail to make AYP for the 3rd year Supplemental Services • Fail to make AYP for the 4th year Corrective Action [staff changes; changes in school day/year; restructuring • Fail AYP after one year of Corrective Action Charter School; State Takeover