Download
1 / 8
80 likes | 406 Views
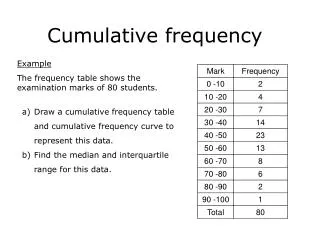
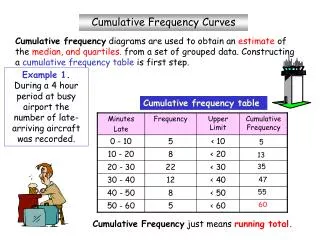
Cumulative Frequency. How to draw a cumulative frequency graph. If the data is jumbled, sort it out by using a table. 23, 24, 34, 45, 56, 23, 57, 41, 37, 65, 17, 26, 35, 44, 33, 48, 19, 61, 58, 55, 49, 44, 57, 43. You must decide sensible intervals.

E N D
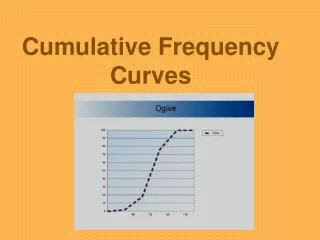
Cumulative Frequency How to draw a cumulative frequency graph
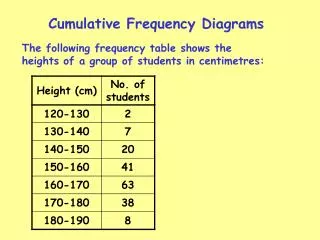
If the data is jumbled, sort it out by using a table 23, 24, 34, 45, 56, 23, 57, 41, 37, 65, 17, 26, 35, 44, 33, 48, 19, 61, 58, 55, 49, 44, 57, 43 You must decide sensible intervals
Complete the third column by adding the second column like this:
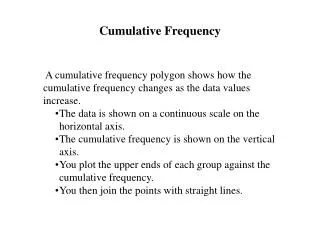
Plot the second number in the data column against the number in the cumulative frequency column Plot these numbers
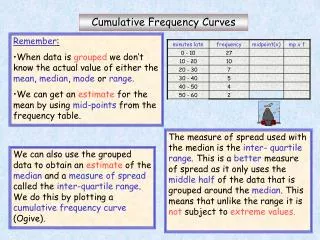
You can use this to find the middle half ¾ (18) ½ (12) Upper Q (53) ¼ (6) Lower Q (30) Median (42)
This means that the middle half is between 30 and 53. Called the inter-quartile range.53 – 30 = 23 The Lower Quartile is 30 Median is 42 The Upper Quartile is 53