Download
1 / 38
440 likes | 1.05k Views
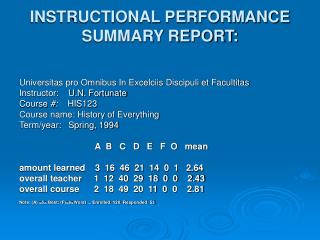
Interpreting the AP Instructional Planning Report. AP Online Score Report System. Goals: To provide educators with AP Exam data in a dynamic and environmentally-friendly format To provide authorized AP teachers with direct access to their students’ scores

E N D
AP Online Score Report System Goals: • To provide educators with AP Exam data in a dynamic and environmentally-friendly format • To provide authorized AP teachers with direct access to their students’ scores • To provide teachers with earlier access to their AP Instructional Planning Reports so they can plan curriculum adjustments in a more timely manner • To provide administrators with aggregate data, disaggregate data, usage reports, & options for updating student data
Steps to View Reports – 1. Login Requires an Educational Professional account User ID and Password
Steps to View Reports – 2. Terms of Use Reports are designed to provide information about the performance of your AP students to guide curricular/instructional planning Reports are NOT to: • evaluate faculty • rank institutions • share with other institutions, students, or families *Will only appear once annually, the first time you wish to access the reports
AP Online Score Report System - Access • AP Course Audit teachers will automatically be given access to the following reports as an Online Score Report teacher: • AP Instructional Planning Report • AP Instructional Planning Report – by section • Subject Score Report • AP Course Audit teachers may be restricted, by administrators, to receive only summary data in the AP Instructional Planning Report
New Online Score Reports & Features Three new reports are now available for school administrators: • Five-Year School Score Summary • AP Scholar Roster • Student Datafile Additional enhancements: • Multiple years’ reports are now available. Your dashboard contains a dropdown to select the exam year (i.e., 2010, 2011, etc.). • You can now search/filter the student score reports by student name or AP number.
AP Online Score Report System – Users (cont.) http://professionals.collegeboard.com/testing/ap/scores/online-score-reporting
Steps to View Reports - 3a. Select Sections • Schools with multiple teachers for a specific subject can use section codes to disaggregate student data by teacher • Benefit: teachers get a true view of their students’ performance • Will only appear • once annually, the first time you access the reports • if school designated section on Student Answer Sheet (only sections used on Answer sheet are displayed) • Teachers can only pick subjects for which they are authorized
Steps to View Reports - 3b. Select Organization / Role Users with multiple organizations or multiple roles will need to select accordinglyUsers with multiple roles will initially be logged in as Administrators
Steps to View Reports - 4. Score Reports Home Starting point to access all reports and system functionsPersonalized to the user’s role organizationThe same data as previous paper reports but with additional features offered by web media Choose to view or customize reportReports run real-time
AP Scholar Roster (New in 2011) Roster showing all AP students who earned an AP Scholar Award, and their AP Exam scores. Available for multiple exam years, starting with 2011. Paper Scholar rosters will no longer be mailed to schools.
Five-Year School Score Summary (New in 2011) your state your school global This report contains five years of data at the school, state and global levels. Also provides subject-specific summaries of total exams, scores and mean scores.
Current Year Score Summary Provides the total numbers of each AP score (1 to 5) for each AP subject offered at your school
School Score Roster Cumulative roster displays all AP students who took AP Exams in 2010 and their AP scores. The report can be customized to display these students’ scores from previous years.
AP Equity and Excellence • Percentage of your school’s entire 10th, 11th and 12th grade classes who scored a 3 or higher on at least one AP Exam • Percentage of each school's senior class that scored a 3 or higher on at least one AP Exam during high school.
Subject Score Roster Roster for each AP subject listing all students & their AP scores
AP Instructional Planning Report (Pg 1) • The top bar graph and chart show how this group of students performed overall versus the global population. • Bottom two bar graphs and charts show student performance on multiple-choice and free-response sections.
AP Instructional Planning Report (Pg 2) • Global Mean - the average scores of all AP students worldwide on specific content categories within the exam • Group Mean – the average scores of your students for specific content categories within the exam • Right-hand side shows how your students fall into global quartiles. Grouping of students in the higher/lower fourths indicates higher/lower performance than the total population. Provides a detailed view of students’ performance on specific content categories on the multiple-choice & free-response sections
Student Score Report Individual, cumulative report for each AP student in your school, listing scores for each AP Exam taken by that student.
College and University Totals Lists the colleges and universities that received your students' AP scores
Student Datafile (New in 2011) A downloadable .csv file containing student score report data for each AP student. This information can be uploaded to other systems, or used for internal analysis and planning. Same as the data that were previously available in the CD that schools ordered for a fee. (Scores on CD are no longer available.) Instructions for using and formatting the file are available in the help text and at www.collegeboard.org/apdatafile.
Contact your Coordinator/Principal if: • You see information that should be corrected: • Students missing from the report or erroneously on the report • Student grade level • Students names (AP Services can only correct nicknames or egregious mistakes) • Same student is listed under two separate AP Numbers • Student score is missing or incomplete • You are switching schools or retiring • You are a Department Head and would like to receive reports for subjects you do not teach
Help Section of Site • Should be helpful in a variety of situations • Highly thorough with a wide array of technical support / Frequently Asked Questions
Interpreting the AP Instructional Planning Report:Implications for Instruction “We can have facts without thinking but we cannot have thinking without facts.” — John Dewey, 1857–1952
AP Instructional Planning Report (Pg 1) • The top bar graph and chart show how this group of students performed overall versus the global population. • Bottom two bar graphs and charts show student performance on multiple-choice and free-response sections.
AP Instructional Planning Report (Pg 2) • Global Mean - the average scores of all AP students worldwide on specific content categories within the exam • Group Mean – the average scores of your students for specific content categories within the exam • Right-hand side shows how your students fall into global quartiles. Grouping of students in the higher/lower fourths indicates higher/lower performance than the total population. Provides a detailed view of students’ performance on specific content categories on the multiple-choice & free-response sections
AP Instructional Planning Report…At A Glance WOW’s! • 50% of my students scored a 5 • ? • ? WHOA’s! • My students’ FRQ scores • ? • ?
Performance on Multiple Choice DATA ANALYSIS Based on the data, are students in your group successful in this content area? What is the evidence to support your assessment of success? Evidence from APIP report? Evidence other than APIP report? Classroom activities Classroom assessments • Content Area: Molecules & Cells • Number of Questions: 26 • Global Mean: 13.5 • Group Mean: 15.7 • # of Students in Each Group: • Highest Fourth: 8 students • Third Fourth: 1 student • Second Fourth: 4 students • Lowest Fourth: 3 students
Performance on Free Response DATA ANALYSIS Based on the data, are students in your group successful in this content area? What is the evidence to support your assessment of success? Evidence from APIP report? Evidence other than APIP report? Classroom activities Classroom assessments • Question/Problem (Topic):Biological Roles of Bacteria • Maximum # of Points Possible:10 • Global Mean: 4.3 • Group Mean: 4.1 • # of Students in Each Group: • Highest Fourth: 3 students • Third Fourth: 4 students • Second Fourth: 4 students • Lowest Fourth: 5 students
Instructional Planning & Practice What implications does analyzing your APIPR have for your instructional practice?
Instructional Planning & Practice What limitations, if any, do you foresee with analyzing AP Instructional Planning Report data?
Instructional Planning & Practice What could you do to overcome these limitations?
Forward Thinking…Short Term • I want to revisit my unit/lessons/activities/assessments for the following concept: • Terms and definitions necessary for grasping this concept include: • Things I can do easily and quickly to tackle this concept include: • Skills my students already use in/out of the classroom • Resources that could be useful in incorporating this concept
Forward Thinking…Long Term • Long-term plans to restructure my course to better address this concept include: • Skills my students already use in/out of the classroom • Resources that could be useful in incorporating this concept • I foresee these challenges….AND possible solutions:
Interpreting AP Scores If you have observed… Most scores in a subject are 1’s and 2’s: • Review the course content against the published Course Description on AP Central to ensure that students are being taught what the exams measure. This is especially true if students whose classroom scores are high do not achieve at least average scores on AP Exams. • Consider the opportunities you have had for Professional Development and factor in student readiness (motivation, reading and writing skills, prior course work). Most AP Scores in a subject are 4’s and 5’s: • It could be possible that the selection criteria for the class are overly rigorous. Consider opening the class to more students. Scores on the multiple-choice and free-response sections of the AP Exams are widely divergent: • Implement practice sessions on test skills for multiple-choice exams, or more assignments during the school year that emphasize writing and organizational skills.