Download
1 / 97
970 likes | 1.28k Views
GIS in Environmental and Water Resources Engineering. Research Progress Report Oct 30, 1998. Texas data and water modeling: Hudgens, Mason, Davis Jonsdottir, Gu, Niazi Environmental Risk Assessment: Hay-Wilson, Romanek, Kim Global runoff: Asante, Lear.

E N D
GIS in Environmental and Water Resources Engineering Research Progress Report Oct 30, 1998
Texas data and water modeling: Hudgens, Mason, Davis Jonsdottir, Gu, Niazi Environmental Risk Assessment: Hay-Wilson, Romanek, Kim Global runoff: Asante, Lear Nonpoint source pollution: Melancon, Osborne Flood hydrology and hydraulics: Ahrens, Bigelow, Perales, Tate Internet: Wei Research Areas
Texas data and water modeling:Hudgens, Mason, Davis Jonsdottir, Gu, Niazi Environmental Risk Assessment: Hay-Wilson, Romanek, Kim Global runoff: Asante, Lear Nonpoint source pollution: Melancon, Osborne Flood hydrology and hydraulics: Ahrens, Bigelow, Perales, Tate Internet: Wei Research Areas
Brad Hudgens Geospatial Data Development for Water Availability Modeling
David Mason Geospatial Data Development for Water Availability Modeling
Stream Network Construction Download and Project rf3 File: Edit rf3 to Obtain “Clean” Network:
Create Outlet Points Using the basin water right coverage as a guide, outlet points were created along the stream network in order to form control points for the eventual watershed delineation:
Trinity River TMDL Subtask on Network AnalystKim Davis
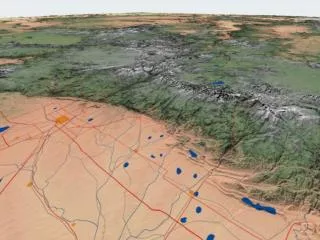
For Starters... This is the Guadalupe River Basin, after using CRWR-Prepro on it and vectorizing the stream links.
It was a good test case because... • Density--I wanted a small data set to learn with • NO GAPS--Network Analyst doesn’t handle gaps or lakes well. • Availability--I had already done the Prepro work for class...
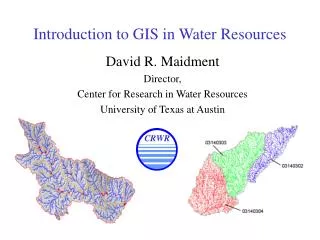
Add some Points of Interest These are evaporation stations from a coverage of Texas. In a real analysis, these might be water rights, point sources, stream gages, etc...
Use Network Analyst This shows the results of route planning from a point to the outlet.
Cool Stuff • Network analyst can be made to look only downstream • Network analyst can be made to look only upstream • Network analyst can look both ways • It can show you hydrologic connectivity • It doesn’t require that input data be digitized • It handles points not EXACTLY on the network
Caveats • Network is very sensitive to digitizing errors • Won’t show you WHERE connectivity is broken • Files must be prepared properly (From Nodes and To Nodes) • Aimed at transportation, not rivers
Jona Finndis Jonsdottir Geospatial Data for Total Maximum Daily Loads
RF3 River Network Rf3 file, where lakes and double lines have been taken out Original RF3 file
Original Rf3 file Simplified version of Rf3, with centerlines
Richard Gu GIS Connections for Hydrologic Modeling
GIS Application to TxRR Ungaged Inflow and Instream Habitat Modeling CRWR, the University of Texas at Austin Texas Water Development Board
TxRR Model Precipitation P InitialAbstraction Direct runoff QD Soil Retention S Maximum Soil Moisture SMMAX Stream Flow Base Flow QB Soil Moisture SM Percolation
Tasks • Preprocessing Tools for TxRR • TxRR Model Execution • Postprocessing Tools for TxRR
Software Environment for TxRR Model Execution Source Data Database Input Data Output data GIS TxRR Program
Database • Database construction is the essential part of the project. • All the data will be stored and used efficiently. • Data linking: • GIS, Database, and TxRR model are constructed independently • Data required for each procedure are retrieved from Database on demand • Output data are written back to database . • Software: Microsoft Access.
Arcview GIS • Preprocessing tools. • Output results display.
Programming Languages • Fortran: TxRR Model Calculation. • Visual Basic: database interfaces. • Avenue: GIS tools developing and function invoking.
Implementation Issues • Speed: Avenue or Basic • Data interactions between programs • Software integration
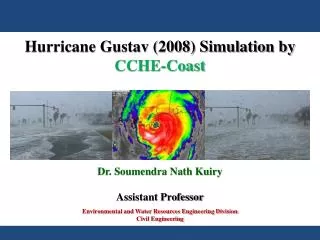
Surface/Subsurface Modeling Progress Report by: Shiva Niazi Ann Dennis October 30, 1998
Overview • Background work conducted by HDR Engineering and LBG Guyton Assoc. • Carrizo- Wilcox Aquifer Model Domain • Conceptualizing the Subsurface/Surface Model • Future Work
Difficulties in modeling the MODFLOW data • MODFLOW model domain is not in “real” map coordinates • Size of grid cells vary • Direction of rows and columns are not standardized to North/South and East/West
Future Work • Locate the MODFLOW model domain on a map • Extract model domain by using county, river reach, HUC and aquifer maps • Investigate the capabilities of Argus One and GMS to manipulate MODFLOW data files
Texas data and water modeling: Hudgens, Mason, Davis Jonsdottir, Gu, Niazi Environmental Risk Assessment: Hay-Wilson, Romanek, Kim Global runoff: Asante, Lear Nonpoint source pollution: Melancon, Osborne Flood hydrology and hydraulics: Ahrens, Bigelow, Perales, Tate Internet: Wei Research Areas
Lesley Hay Wilson Spatial Environmental Risk Assessment
Current Research Status • Drafting dissertation proposal • Objective is to develop the spatial risk assessment methodology • Spatial Risk Assessment (SRA) is the process of identifying and quantifying the potential for adverse effects to human or ecological receptors from chemicals or radioactive materials released to the natural environment within a spatially-referenced, integrated modeling environment
Necessary Elements of the SRA Methodology • Spatial Site Conceptual Model • Connections to implement map-based modeling of fate & transport • Meta data protocols for environmental measurements and derived results • Managing time-dependent data sets • Visualization of uncertainty • Communication tools
Other Activities • Completed workshop for PaDEP and EPA on the first CD (team) • Presented two papers at the ASCE Geo Institute meeting, co-authored third paper • Working on poster for ESP meeting next week (team) • Completing paper for the 1999 CSIRO Remediation Conference (team)
Andrew Romanek Surface Representation of the Marcus Hook Refinery
Current Activities • Team Efforts: • PADEP Workshop on ArcView and Access • ESP Poster • 1st year progress CD • Groundwater Model with GMS • Seminar next Wednesday
Groundwater Results • Lube Plant Area • Steady State • 3 layer simplification • Where from here???
Spatial Analysis of Sources and Source Areas on Marcus Hook Progress report by Julie Kim Friday, October 30, 1998
Objective • To find a correlation between where chemicals were stored and where they were detected within the Lube Plant
Getting Started: Data Acquired • Sept. 11, 1998 Former Marcus Hook Refinery progress documentation CD-Rom • Tosco’s Environmental baseline assessment of areas of concern (AOC) • Summary of chemicals of concern (COC) issues compiled on Sept. 28, 1998 • Appendix of data quality classification system
Current Work • Compile map of coverages using CD-Rom: tank, old RCRA units, and historical • Identify each unit or AOC and look up basis of concern in Tosco database • Determine materials and volumes stored, time period of operation, and releases • Determine quality of data
Future Work • Develop contour maps of COC with associated data quality levels • Determine correlation for the entire facility
Texas data and water modeling: Hudgens, Mason, Davis Jonsdottir, Gu, Niazi Environmental Risk Assessment: Hay-Wilson, Romanek, Kim Global runoff: Asante, Lear Nonpoint source pollution: Melancon, Osborne Flood hydrology and hydraulics: Ahrens, Bigelow, Perales, Tate Internet: Wei Research Areas