Download
1 / 18
180 likes | 400 Views
Key Input Assumptions for 2019 RTP Economic Analysis Sandeep Borkar. Agenda. Weather year selection Panhandle interface l imit m argin Miscellaneous updates. Weather Year Selection. Weather Year Selection. Weather Year Selection (Rank). Weather Years Selection.

E N D
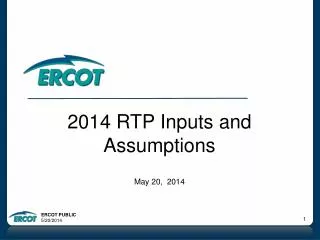
Key Input Assumptions for 2019 RTP Economic Analysis Sandeep Borkar
Agenda • Weather year selection • Panhandle interface limit margin • Miscellaneous updates
Weather Years Selection • 2013 will be the base year selected for 2019 RTP Economic Analysis • 2010 and 2004 will be selected as the two additional weather scenario for Economic transmission planning • Load, Wind and Solar profiles for appropriate years will be used in UPLAN economic transmission planning analysis
Background • ERCOT’s Panhandle Interface was established in June 2015 • Over the years the interface limit has been based on lower of System Strength or Voltage Stability limits • A 90% margin was used in prior ERCOT planning studies based on operations experience and feedback
Review of Historical Margins • Reviewed the historical SCED interval data when the panhandle interface was binding
Observations • In 2017 and 2018, the Panhandle Limit was being monitored at 95% of the Stability/WSCR limit • There has been a gradual shift towards 95% following more operating experience in the region
Conclusion • ERCOT will use 95% of the Stability/WSCR as the panhandle interface limit in its 2019 RTP and 2020 LTSA economic planning analyses • Panhandle Interface Limit for 2021 and 2024 will be set at 4,519 MW • Panhandle Interface definition will include 345-kV circuits between • Tesla to Jim Treece/Riley • Tesla to Edith Clarke • Cottonwood to Edith Clarke • Cottonwood to Dermott • Ogallala to Abernathy • White River to Abernathy
Input Assumptions: Start Cases • Start Cases • Transmission topology based on 2021 and 2024 Final Reliability Cases from 2018 RTP • P1 and P7 Contingencies applicable to above start cases • LPL will be included in North Weather Zone • Temperature-dependent dynamic ratings based on Operations data used where available
Natural Gas Price Assumptions • Natural Gas Price forecast for 2019 RTP will be based on the 2018 EIA AEO High Oil and Gas Production case Natural Gas Price Forecast (Nominal $/MMBtu)
Emission Cost Assumptions Source: EPA Website
Questions & Feedback Contact info: Sandeep Borkar sandeep.borkar@ercot.com 512.248.6642 Naga Kota Naga.Kota@ercot.com 512.248.3173