Download
1 / 76
760 likes | 968 Views
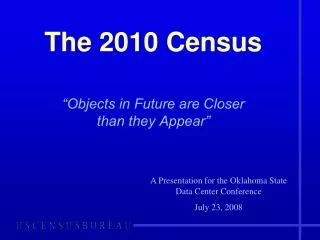
The 2010 Census and Demographic Change. Leo F. Estrada, PhD UCLA School of Public Affairs. The Origins of the Census. “The Great Experiment” Congressional Representation based on population First Census—1790 (10 year intervals) Census-racial distinctions Collection of household information.

E N D
The 2010 Census and Demographic Change Leo F. Estrada, PhD UCLA School of Public Affairs
The Origins of the Census • “The Great Experiment” • Congressional Representation based on population • First Census—1790 (10 year intervals) • Census-racial distinctions • Collection of household information
Census Timeline Late January 2010: media outreach begins Mid-March: forms mailed out to 100 million households April 1, 2010: Census Day May – July 2010: phone follow-up interviews July – September 2010: interview follow-up October – December: data processing December 31, 2010: Final results presented to the U.S. President
The 2010 “Short” Census Name Sex Age Date of Birth Hispanic Origin Race Household Relationships Own or rent
The American Community Survey On-going monitor 77K households per month Data summed up annually In 2010, survey sample will be of 1 million households Characteristics of population will be determined by ACS (i.e., education, occupation, home value, income, etc)
The Undercount? • Every 1% of undercount is = to 3 Million • The undercount in 2000 was 2.78% • Most likely to be undercounted: • Granny flats (address undercount) • Babies (intra-household undercount) • Youth (permanent residence) • Transients (permanent residence) • Immigrants (distrust, fear)
Outreach Importance of outreach for cooperation Trusted sources of information Alleviate confidentiality and privacy concerns
Why the Census Matters • Reapportionment/Redistricting • Restructuring political space • Government funding--$400 Billion for transportation, hospitals, schools, public works, etc. • Source for understanding markets
US Population Growth, 2000-2008 U.S. Census Bureau, ACS, 2007 and 2008
Demography and Latinas • Population change is due to: • Births • Deaths • Net Migration • Future of the U.S is aligned with the future trends of Latinas
Projections in Elementary School Minority Aged Children 2000 to 2025 (in thousands) Source: U.S. Bureau of the Census, CPS, P25-1130
Source: Pew Hispanic Center and American Community Survey 2005
Age Distribution by Sex and Hispanic Origin: 2000 (In percent) Hispanic Non-Hispanic White age Male Female Male Female Source: Current Population Survey, March 2000, PGP-4
Immigration *Immigration is an global phenomena *Immigrants are risk takers *Immigrants revitalize decaying urban areas *Immigrants reduce the rate of wage growth
U.S. Citizenship of the Foreign-Born Hispanic Population by Year of Entry: 2000 (in percent) Percent Source: Current Population Survey, March 2000, PGP-4
16 States Will Account for 90% of All Future Growth in the US California Virginia Texas Tennessee Florida Utah Georgia South Carolina Arizona Oregon Washington Michigan North Carolina Nevada Colorado Minnesota
California Population by Race/Ethnicity1970-2007 Source: United States Census Bureau
California Latinos will become the single largest ethnic group Source: California Department of Finance
CALIFORNIA 1990 Other (42%) White (58%)
CALIFORNIA 2020 White (41%) Other (59%) Department of Finance, Urban Research Unit, Report 88, P-4
CALIFORNIA 2040 White (31%) Other (69%) Department of Finance, Urban Research Unit, Report 88, P-4
U.S. Latinos--The Fourth Largest Latino “Nation” • 1. Mexico 110 million • 2. United States 46.9 million • 3. Colombia 44.4 million • 4. Spain 41.3 million • 5. Argentina 36.0 million • 6. Peru 28.7 million • 7. Venezuela 26.4 million • 8. Chile 16.4 million • 9. Ecuador 13.7 million • 10 Guatemala 13.0 million The number for the U.S is 51.4 million including Puerto Rico