Download
1 / 52

E N D
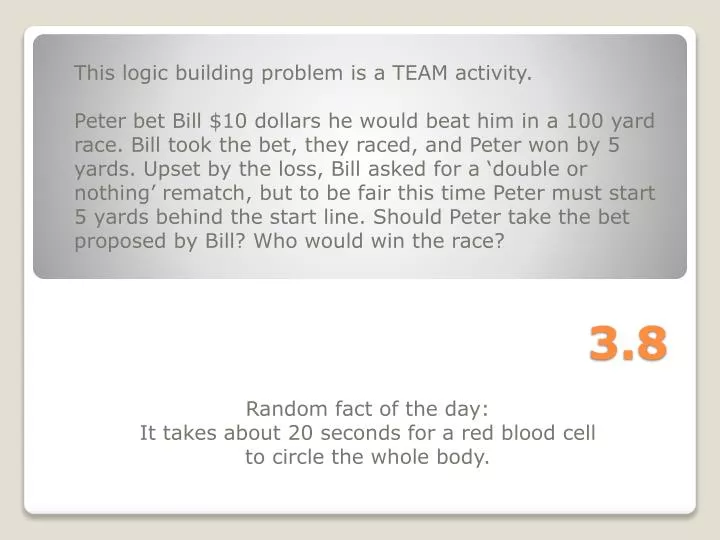
3.8 This logic building problem is a TEAM activity. Peter bet Bill $10 dollars he would beat him in a 100 yard race. Bill took the bet, they raced, and Peter won by 5 yards. Upset by the loss, Bill asked for a ‘double or nothing’ rematch, but to be fair this time Peter must start 5 yards behind the start line. Should Peter take the bet proposed by Bill? Who would win the race? Random fact of the day: It takes about 20 seconds for a red blood cell to circle the whole body.
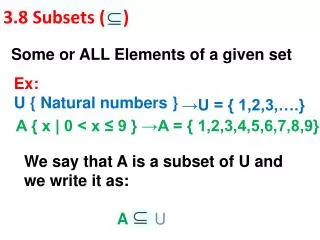
What is a rate? • What is a ratio? • What is a percent? Rates, Ratios, and Percents
What is a rate?Relationship between 2 quantities measured in different units. • What is a ratio?Relationship between 2 quantities measured in the same unit. • What is a percent?A ratio where 1 quantity is compared to 100 in the same unit Rates, Ratios, and Percents
What is a unit rate? Relationship of one quantity to one unit of another different quantity. Rates, Ratios, and Percents
Lets look at some unit rate examples Rates, Ratios, and Percents
Example 1: You are with your mother at Big Y and she is comparing Olive Oil. Analyze the prices below and decide which is the best deal. (hint: the work is already done for you) Rates, Ratios, and Percents
Unit RateExample 2 (with no work done for you): Now you are in the dairy section of Big Y. Which milk gives you the best deal?GallonHalf-gallonQuartPint $5.09 $2.79 $1.79 $0.99 Rates, Ratios, and Percents
Unit RateExample 3: Suppose a farmer has two fields. He recently harvested 10,000 ears of corn in the 4 acre field, and 12,000 ears in the 5 acre field. Rates, Ratios, and Percents
Unit RateExample 3: Suppose a farmer has two fields. He recently harvested 10,000 ears of corn in the 4 acre field, and 12,000 ears in the 5 acre field.To truly compare and analyze his harvesting efficiency, the farmer must look at the unit rate of harvest (the ears per one acre) for each field. Rates, Ratios, and Percents
You have $5.00 to spend on peanut butter. • Which brand should you choose based on the money? • What are some factors that might influence your decision besides money? Grocery Store Problem
The table below shows the car mileage and gasoline use for Mr. Butler’s car. Estimate how far he can drive on a full tank of gas (18 gallons). Mileage
The table below shows the car mileage and gasoline use for Mr. Butler’s car. Estimate how far he can drive on a full tank of gas (18 gallons). Mileage
How does this rate compare with the advertised rate? • What type of terrain might I drive on to get these rates? Mileage
You just landed in Madrid, Spain and are very hungry after your flight. Exchange Rate Problem
You walk past a pizzeria and notice they have medium pizzas for $16 euros, and a meatball grinder for $7 euros. However you only have a twenty dollar bill from back home. Exchange Rate Problem
You go to the nearest money exchange kiosk to exchange $20 USD for euros. Will you have enough for the pizza? Or do you settle for the grinder??? Exchange Rate Problem
What is the difference between a rate and a ratio? • Give me an example (not mentioned in class) of a unit rate in real life. • For a science project, Mike wanted to test the life of a regular incandescent light bulb versus an energy saving light bulb. He determined that he could burn through 8.5 incandescent bulbs in the time it took to use up one energy saving bulb. The energy saving bulb lasted 10,000 hours, so to determine the unit rate for each regular bulb he divided 10,000 into 8.5 to get a unit rate of .00085 hours per incandescent bulb. The Closer
4.1 This logic building problem is a SOLO activity. Ron Jon bought a pack of baseball cards and found a rookie card worth $10. He decided to sell it to his friend Tommy Bahama for $10. After the baseball season ended, the card went up in value and Ron Jon bought it back from Tommy Bahama for $15. The following year, Ron Jon sold the card for $8. Did Ron Jon make or lose money on the card? Random fact of the day: In most watch advertisements the time displayed on the watch is 10:10 because then the arms frame the brand of the watch (and make it look like it is smiling).
What can you tell me about this type of graph? Also known as: Coordinate plane Cartesian Coordinate Plane Coordinate Grid
What can you tell me about this type of graph? Also known as: Coordinate plane Cartesian Coordinate Plane Coordinate Grid
Where are the quadrants? Coordinate Grid
Where are the quadrants? • Which axis is x? y? Coordinate Grid
Where are the quadrants? • Which axis is x? y? • Which axis is dependent? Independent? Coordinate Grid
Where are the quadrants? • Which axis is x? y? • Which axis is dependent? Independent? Coordinate Grid
What does it mean when I say something in a graph is dependent? Independent? Coordinate Grid
In your head think: “Does ___ depend on ____?” The thing that ‘depends’ is the dependent variable on the y-axis. Coordinate Grid
For example, which is dependent/independent? 1. Milesdriven and the amount of gas used. 2. Widthof a tree and its age. 3. Priceof apples and the amount harvested. Coordinate Grid
The ‘x’ value is always said first So how do we say this point?
(7,3) So how do we write this point?
A scatter plot is a graph that consists of points. • These points describe a relationship between two distinct quantities. Scatter Plot
Lets plot the points below(70, 55.4) (96, 59.4)(92, 59.2)(80, 56)(82, 57)(84, 57.2)(100, 60)(88, 57.8)(76, 55.5)(78, 56.4) Scatter Plot
Lets plot the points below(70, 55.4) (96, 59.4)(92, 59.2)(80, 56)(82, 57)(84, 57.2)(100, 60)(88, 57.8)(76, 55.5)(78, 56.4) Scatter Plot
How does the dependent variable appear to change in relation to the independent variable? Scatter Plot
Can we estimate a future value given these points? Scatter Plot
Can we estimate a future value given these points?What output (y) might an input (x) of 110 give us? Scatter Plot
What could be a possible scenario for this data? Scatter Plot
Scatter Plot Is this graph still a reliable predictor of a future value? Why or why not?
If we were to create a scatterplot comparing the sales of CD’s to digital downloads, how do you think they would change over time? Scatterplots continued
When does the sale of downloads surpass the sale of CD’s? Scatterplots continued
Has digital downloads helped or hurt music sales according to this graph? Why? Scatterplots continued