Download
1 / 24
350 likes | 643 Views
Live Market Hog Evaluation and Grading. Developed by: B. A. Reiling, Ph.D. University of Nebraska-Lincoln. Visual Evaluation. Subjective Less accurate than real-time ultrasound Less expensive, more convenient Still important for selection decisions Still important for marketing decisions.

E N D
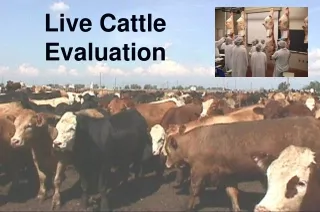
Live Market Hog Evaluationand Grading Developed by: B. A. Reiling, Ph.D. University of Nebraska-Lincoln
Visual Evaluation • Subjective • Less accurate than real-time ultrasound • Less expensive, more convenient • Still important for selection decisions • Still important for marketing decisions
Weight Live weight (LW) Carcass weight (HCW) Dressing Percent (DP) Relates LW to HCW HCW = LW X DP Leanness 10th rib fat thickness Last rib fat thickness Muscle Loin muscle area USDA muscle score Value-determining Traits
Live Weight Range: 230 – 300 lbs Average: 272 lbs Dressing Percentage Range: 68 – 78% Average: 75% Affecting factors Fill, muscle, fat Carcass Weight = LW * DP ~ 200 lbs Length First rib to aitch bone Shoulder point to ham Range: 28-34 in Avg: 31 in () Average Values
How Do Animals Get Fat? • Top to Bottom • Front to Rear • Gender Effects • Gilts leaner than barrows
Body Shapes – Rear View • Heavy muscled hogs are wide based Desirable Undesirable
Body Shapes – Top View • Lean hogs = “hourglass shape” • Fat hogs = “boat shape” Desirable Undesirable
5 7 5 8 Evaluation of Fat Deposition 4) Elbow pocket 5) Loin edge 6) Flank 1) Jowl 2) Blades 3) Forerib 7) Tail head 8) Ham seam 3 2 6 4 1
Average Values • Last rib fat thickness • Used for calculation of lean content in the industry • 10th rib fat thickness • ¾ length of the eye muscle; corresponds with “loin edge” • Used to calculate % muscle • Range: 0.35 – 1.2 in () • Avg: .7 in • But, carcasses are NOT ribbed
Wt = 247 lbs Wt = 252 lbs How Lean? How Fat?
LRF, in 0.60 10th rib fat, in 0.30 LEA, sq in 9.50 % Lean 63.16 LRF, in 1.00 10th rib fat, in 1.60 LEA, sq in 4.50 % Lean 39.82 How Lean? How Fat?
4 Thick Ended Evaluation of Muscle 1) Shoulder 2) Forearm 3) Loin (top) 4) Ham/stifle 3 1 2
Average Values • Loin Eye Area (LEA) • Loin Muscle Area (LMA) • Longissimus dorsi • Ultrasound measure • Range: 4.5 – 10.0 in2 • Avg: ~ 6.0 in2 ()
USDA Carcass Grading Two Factors: • Last rib backfat (LRBF) • Muscle Score (MS) • Thick = 3 • Average = 2 • Thin = 1 • = (4 * LRBF) – MS • Thin muscled hogs ineligible for USDA #1
USDA Muscle Scores Thin = 1 Average = 2 Thick = 3
Cutability Values • Various equations to predict % muscle (lean) • May include 0 (fat-free), 5 (marbling), or 10% fat • Observations • As live weight , % muscle • As fat cover , % muscle • As LEA , % muscle Critical Factors = Fat Cover and Weight
Short-cut Method 250 lb live weight = base For every 10 lbs below; add 0.2% For every 10 lbs above; subtr 0.2% 0.8 inches 10th rib fat = base For every 0.1 in below; add 1% For every 0.1 in above; subtr 1% 5.5 in2 LMA = base For every 0.1 in above; add 0.2% For every 0.1 in below; subtr 0.2% Typical range: 48-60% Extremely lean pigs >60% With heavy-weight hogs Frame very important Can use ultrasound Pounds of fat-free lean: .833 * Sex (barrow = 1, gilt = 2) + .291 * live weight, lbs - 16.498 * 10th rib fat, in + 5.425 * LMA, in2 - .534 Percentage Fat-Free Lean • Convert percentage lean • pounds of fat-free lean • live weight X 100
Practice 1 77.6% 187 lbs 0.60 in 0.50 in 8.0 in2 2 0.4 58.1% Dress % Hot Carcass Wt LRBF 10th Rib Fat LEA Muscle Score USDA Grade % Lean Live Weight = 241 lbs
Practice 2 77.9% 214 lbs 1.00 in 1.05 in 7.4 in2 2 2.0 50.2% Dress % Hot Carcass Wt LRBF 10th Rib Fat LEA Muscle Score USDA Grade % Lean Live Weight = 274 lbs
Practice 3 73.0% 186 lbs 0.70 in 1.00 in 5.9 in2 2 0.8 48.9% Dress % Hot Carcass Wt LRBF 10th Rib Fat LEA Muscle Score USDA Grade % Lean Live Weight = 254 lbs