Download

1 / 21
210 likes | 353 Views
Jeff Sweeney University of Maryland Chesapeake Bay Program Office jsweeney@chesapeakebay.net 410-267-9844 http://www.chesapeakebay.net/ Tributary Strategy Workgroup Phase 5 Meeting Chesapeake Bay Program Office January 26, 2005. Tributary Strategy Workgroup

E N D
Jeff Sweeney University of Maryland Chesapeake Bay Program Office jsweeney@chesapeakebay.net 410-267-9844 http://www.chesapeakebay.net/ Tributary Strategy Workgroup Phase 5 Meeting Chesapeake Bay Program Office January 26, 2005 Tributary Strategy Workgroup Discussion of Phase 5 Watershed Model
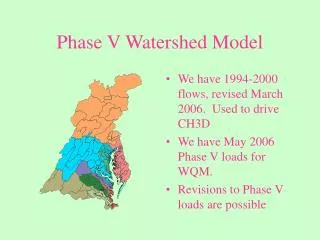
Phase 5 Atmospheric Deposition • Need to know the spatial and temporal variations in the concentrations of dissolved substances in precipitation. • From monitoring station wet-fall: • Daily precipitation volumes • Weekly NH4+ concentrations • Weekly NO3- concentrations • Phase 4 Watershed Model • 15 NADP/NTN monitoring stations • 1984-1992 • Phase 5 Watershed Model • 29 NADP/NTN monitoring stations • 6 AirMoN monitoring stations • 1984-2001
Phase 5 Atmospheric Deposition • Need to know the spatial and temporal variations in the concentrations of dissolved substances in precipitation. • From monitoring station wet-fall: • Daily precipitation volumes • Weekly NH4+ concentrations • Weekly NO3- concentrations • Wet-fall concentration model yields: • Daily NH4+ concentrations • Daily NO3- concentrations • Daily precipitation volumes and daily inorganic concentrations yield: • Daily deposition of NH4+ and NO3- in wet-fall
Phase 5 Atmospheric Deposition • Wet-fall concentration model: Log10(c) = bo + b1log10(ppt) + b2sseason + b3v3 + . . . + bnvn +e where, c = daily wet-fall ionic concentration (mg/L) bo = intercept ppt = daily precipitation volume (inches) b1 = coefficient for precipitation term season = vector of 5 binary indicator variables encoding the 6 bi-monthly seasons b2s = vector of 5 coefficients for season terms v3 . . Vn = additional predictors selected through stepwise regression • National Land Cover Data (NLCD) • Within proximities of 0.8, 1.6, 3.2, 8.0, and 16.1 km of each NADP/NTN site • Open water, forested, residential, industrial/transportation, croplands, and vegetated wetlands • Local emission levels of ammonia and nitrous oxides from EPA National Emission Trends (NET) • County emission totals 1985-1999 • County containing each NADP/NTN monitoring site and for the nearest 3 counties b3 . . bn = coefficients corresponding to v3 . . Vn e = residual error
Phase 5 Atmospheric Deposition NH4+ Wet-fall Concentration (mg/L) May 1, 1998 NH4+ Wet-fall Deposition (kg/ha) May 1, 1998 Estimates produced by applying daily ammonium concentration model to grids of estimated daily precipitation from the National Weather Service Climate Prediction Center’s U.S. Daily Precipitation Analyses.
Phase 5 Atmospheric Deposition NO3- Wet-fall Concentration (mg/L) May 1, 1998 NO3- Wet-fall Deposition (kg/ha) May 1, 1998 Estimates produced by applying daily nitrate concentration model to grids of estimated daily precipitation from the National Weather Service Climate Prediction Center’s U.S. Daily Precipitation Analyses.
Phase 5 Atmospheric Deposition NH4+ Wet Deposition (kg/ha) Mean annual (1985-2001) NO3- Wet Deposition (kg/ha) Mean annual (1985-2001) Estimates produced by applying daily ammonium and nitrate concentration model to grids of estimated daily precipitation from the National Weather Service Climate Prediction Center’s U.S. Daily Precipitation Analyses.
Phase 5 Atmospheric Deposition Total Inorganic Nitrogen Wet Deposition (kg/ha) Mean annual (1985-2001) Estimates produced by applying daily NH4+ and NO3- concentration model to grids of estimated daily precipitation from the National Weather Service Climate Prediction Center’s U.S. Daily Precipitation Analyses. Estimates produced by applying daily NH4+ and NO3- concentration model to estimates of daily precipitation from a high resolution hourly precipitation model developed by the USGS for river modeling segment in the CB watershed.
Phase 5 Atmospheric Deposition • Models-3/Community Multi-scale Air Quality (CMAQ) Modeling System: • Replaces Regional Acid Deposition Model (RADM) in Phase 5 • Provides estimates of nitrogen deposition resulting from changes in precursor emissions from utility, mobile, and industrial sources due to management actions or growth. • Adjusts deposition determined by wet-fall concentration model and precipitation volumes • Predicts the influence of source loads from one region on deposition in other regions. • Provides estimates of wet:dry for nitrate and ammonium.
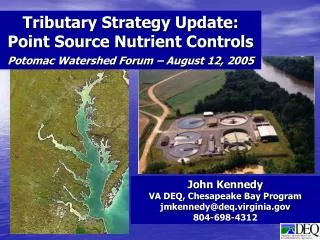
Phase 5 Atmospheric Deposition Atmospheric Inputs: Of the total NOx deposition to the Chesapeake Bay watershed land area, about 50% originates from emissions in Bay-watershed states: PA = 17%, VA = 10%, MD = 9%, WV = 7%, NY = 5%, DE = 1% OH, NC, NY, KY, IN, TN, MI = 27% Other States in 37-State Area = 24%
Phase 5 Animal Nutrient Balance In Phase 4, there is no direct connection between estimated storage and handling losses and the hard-wired load from animal feeding operations, i.e., “manure acres”.
Phase 5 Animal Nutrient Balance Accounted for in the Watershed Model simulation but, generally, not part of atmospheric deposition Accounted for in the input decks to the Watershed Model but, generally, not part of atmospheric deposition
Phase 5 Animal Nutrient Balance Ammonia and Ammonium Sources and Emissions
Phase 5 Septic Systems and Loads 1990 Versus 2003 Calculated Septic Systems 2003 Septic EOS Load = 2003 population * 1990 fraction of population on septic * lbs TN/person edge-of-field * pass-through factor 2003 Septic Systems = (2003 population * 1990 fraction of population on septic / 1990 people/system) – state-reported septic connections BMP
Phase 5 Septic Systems and Loads • WV reported systems are 52% above what is calculated. • DE reported systems are 29% above what is calculated. • Press reports 460K septic system in MD – compared to 340K systems calculated. • No current system data from NY, PA, MD, and VA.
Phase 5 Septic Systems and Loads • The septic connection BMP reduces the calculated number of systems.
Jeff Sweeney University of Maryland Chesapeake Bay Program Office jsweeney@chesapeakebay.net 410-267-9844 http://www.chesapeakebay.net/ Tributary Strategy Workgroup Phase 5 Meeting Chesapeake Bay Program Office January 26, 2005 Tributary Strategy Workgroup Discussion of Phase 5 Watershed Model