Download
1 / 59
590 likes | 610 Views
Summarizing the key points from the agriculture outlook meeting in Iowa Falls on Dec. 6, 2016, including corn and soybean supply and use, yield estimates, crop margins, livestock market updates, and more.

E N D
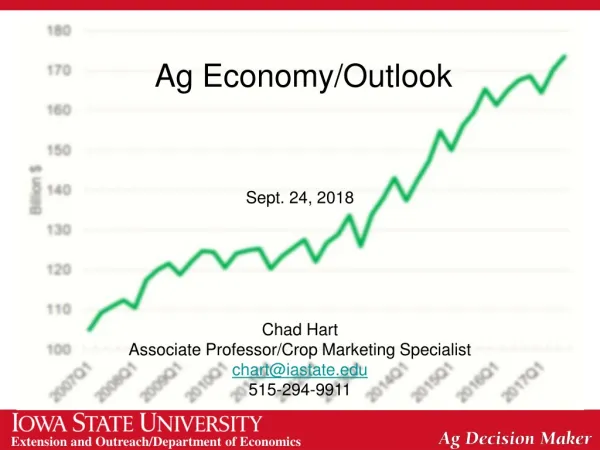
Ag Outlook GNB Bank Meeting Iowa Falls, IA Dec. 6, 2016 Chad Hart Associate Professor/Crop Markets Specialist chart@iastate.edu 515-294-9911
U.S. Corn Supply and Use Source: USDA-WAOB
U.S. Soybean Supply and Use Source: USDA-WAOB
Corn Yield Estimates Top: 2016 Yield Bottom: Change from last month Units: Bushels/acre Source: USDA-NASS
Soy Yield Estimates Top: 2016 Yield Bottom: Change from last month Units: Bushels/acre Source: USDA-NASS
World Corn Production Source: USDA-WAOB
World Soybean Production Source: USDA-WAOB
Drought Monitor Source: National Drought Mitigation Center
Hog Crush Margin The Crush Margin is the return after the pig, corn and soybean meal costs. Carcass weight: 200 pounds Pig price: 50% of 5 mth out lean hog futures Corn: 10 bushels per pig Soybean meal: 150 pounds per pig Source: ISU Extension
Cattle Crush Margin The Crush Margin is the return after the feeder steer and corn costs. Live weight: 1250 pounds Feeder weight: 750 pounds Corn: 50 bushels per head Source: ISU Extension
U.S. Meat Production & Prices Source: USDA-WAOB
Corn Export Sales Source: USDA-FAS
Change in Corn Export Sales Source: USDA-FAS
Soybean Export Sales Source: USDA-FAS
Change in Soybean Export Sales Source: USDA-FAS
Strength of the U.S. Dollar Source: Federal Reserve
Crude Oil Prices Sources: EIA and CME
Current Corn Futures 3.67 3.35 Source: CME Group, 12/5/2016
Current Soybean Futures 9.84 9.73 Source: CME Group, 12/5/2016
Beef: + 2015.Q4 Pork: + 2015.Q1 Total Poultry: +2012.Q4 Data Source: USDA-NASS, Compiled & Analysis by LMIC Livestock Marketing Information Center
2017 2016 2015 Data Source: USDA/ERS
2016 Beef Cattle Situation • Transition to larger beef supplies in 2016 has been challenging • Cow-calf: Converging toward long-term levels • Herd expansion slowed, stalled, or stopped? • Stocker: Varies widely across situations • Opportunities vs. risk of owning cattle and managing risk • Feedlot: Worst behind us (I think), still red ink • Structural concerns—excess capacity, price discovery, etc.
Data Source: USDA & LMIC, Compiled by LMIC Livestock Marketing Information Center
Beef Cow Culling Rates 2005 = 7.7% (6.6%) 2006 - 2007 = 9.4% (8.0%) 2008 - 2012 = 11.2% (9.6%) 2013 = 10.5% (9.1%) 2014 = 8.8% (7.7%) 2015 = 7.6% (6.5%) 2016 = 7.1% (7.1%) 2016 Slaughter +13.0% (vs. 2015) -23.2% (vs. 2010-14) Data Source: USDA-AMS & USDA-NASS Livestock Marketing Information Center
36.8% is average between 1996‐2016 HEIFER REPLACEMENTS 2016: +3.5% 2015: +9.6% 1993: +8.0% 1982: +7.7% Data Source: USDA/NASS
Cattle on Feed―11/18 report • (1,000+ head capacity feedlots; & < 1,000 in Iowa) • Oct 1 On Feed: -1.3% yr/yr • Vs. -1.1% pre-report est. -2.3%, -0.5%) • IA: -6.3% vs last year [1,000+ Head] • IA: 0.0% vs last year [<1,000 Head] • Sep Placements: -5.0% • Vs. -4.9% pre-report est. (-10.1%, -3.4%) • IA: -17.3% vs last year [1,000+ Head] • IA: +11.0% vs last year [<1,000 Head] • Sep Marketings: +4.6% • Vs. +4.4% pre-report est. (+3.1%, +6.5%) • IA: -15.0% vs last year [1,000+ Head] • IA: -36.5% vs last year [<1,000 Head] -3.5% -7.6% -24.2% Data Source: USDA/NASS
Steer Live Weights This week: 1,447 Last week: 1,464 Last year: 1,453 Heifer Live Weights This week: 1,322 Last week: 1,320 Last year: 1,294 Data Source: USDA-NASS, Compiled & Analysis by LMIC Livestock Marketing Information Center
Data Source: USDA-AMS Livestock Marketing Information Center
2013 = -$59.43 [-$155 to +$77] 2014 = +$197.24 [+$41 to +$ 269] 2015 = -$225.12 [-$530 to +$43] 2016f = -$113.29 [-$359 to +$113] 2017f = -$26.44 [-$108 to +$114]
U.S. Beef Exports, Jan-Sep 2016 (Volume excluding by-products & variety meats) WASDE U.S.: 2015: 2,265 mil lbs 2016: 2,459 (+9%) 2017: 2,630 (+7%) Source: USDA/ERS
U.S. Beef Imports, Jan-Sep 2016 (Volume excluding by-products & variety meats) WASDE U.S.: 2015: 3,371 mil lbs 2016: 3,011 (-11%) 2017: 2,680 (-11%) Source: USDA/ERS
Relative Changes in Beef & Cattle Prices Source: USDA/ERS, USDA/AMS
2016 Pork Situation • Processing capacity squeeze. 1998 Déjà vu??? • Demand is always an important driver. But we first need to understand supply dynamics. • Lower hog and pig prices have likely raised the red flag on further expansion, at least for now. • Longer-term additional expansion is quite possible • Low feed grain prices, packer competition • Revisions to H&P report complicate analysis
Data Source: USDA-ERS & USDA-FAS Livestock Marketing Information Center
2013 = +$6.21 [-$25.60 to +$24.57] 2014 = +$61.85 [+$13.15 to +$107.25] 2015 = +$7.93 [-$18.40 to +$26.25] 2016f = -$1.46 [-$30.11 to +$32.92] 2017f = -$4.40 [-$23.31 to +$17.97]