Download
1 / 11
120 likes | 290 Views
The Demographic Transition Model. Please read pages 70-79. Conceived by Frank Notestein 1945. Model of population change based upon effects of economic development .

E N D
The Demographic Transition Model Please read pages 70-79
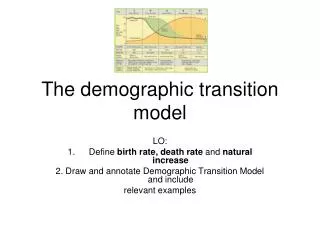
Conceived by Frank Notestein 1945. • Model of population change based upon effects of economic development. • Based on the experience of the Western world, it was used for decades as a model to predict what should/would happen to developing countries eventually. • All countries pass through four (or five) stages to a state of maturity.
Phase 1 Birth Rate Death Rate Rates Population Time
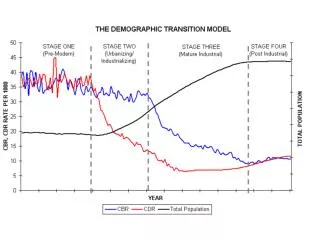
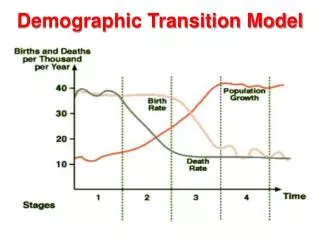
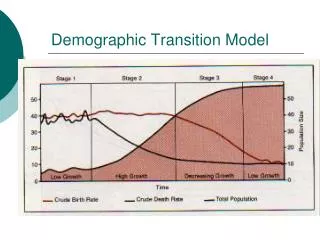
Stage 1: High steady birth rates and high but fluctuating death rates. Two rates are approximately equal, therefore, low natural increase rate. Population grows slowly, if at all. The death rate fluctuates due to war and disease. Low income, agricultural society.
Phase 1 Phase 2 Birth Rate Death Rate Rates Population Time
Stage 2: Dramatic decline in death rates; high birth rates remain high. Onset of industrialization. Improvements in health and medical advances. Improvements in food production. Population growth rate soars.
Phase 1 Phase 2 Phase 3 Birth Rate Death Rate Rates Population Time
Stage 3: Low death rates; birth rates start declining. Natural increase rate declines. But population continues to grow. Birth rate declines due to voluntary decisions to reduce family size aided by improved contraception and to improved standard of living.
Phase 1 Phase 2 Phase 3 Phase 4 Birth Rate Death Rate Rates Population Time
Stage 4: Low steady death and birth rates. Low natural increase rate, similar to Stage 1. Population growth rate falls. Population is large but not growing.
Stage 5: Low death rates; declining birth rates. Birth rates below “replacement levels”. Population eventually begins to decline.