Download
1 / 13
130 likes | 241 Views
Present-Day Immigration. In the 1970’s the population grew from 203 million to 226 million, as well as becoming more diverse. . The U.S. population as of the 2010 Census?. 308,745,538. Present-Day Immigration. About 500,000 immigrants arrived in the U.S. each year during the 1970’s.

E N D
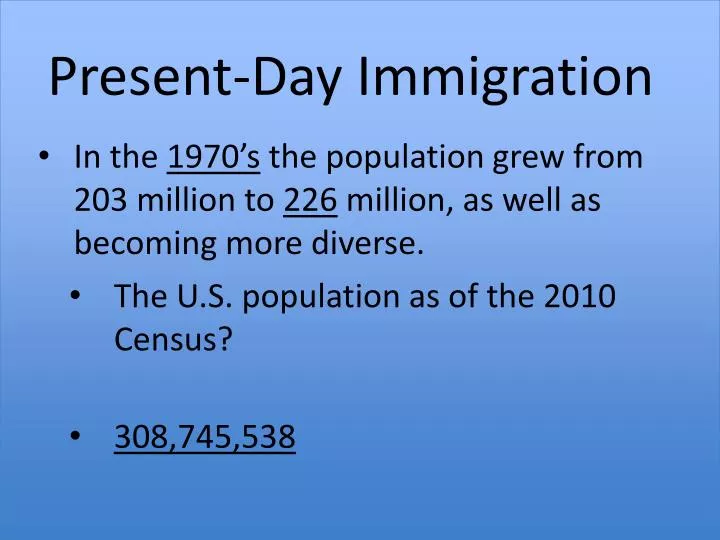
Present-Day Immigration • In the 1970’s the population grew from 203 million to 226 million, as well as becoming more diverse. • The U.S. population as of the 2010 Census? • 308,745,538
Present-Day Immigration About 500,000 immigrants arrived in the U.S. each year during the 1970’s. Highest number since the early 1900’s when the U.S. had an Open-Door policy. Most of these people migrated from: Philippines, Korea, China, India, Laos, Cambodia, + Vietnam
Present-Day Immigration Also, a huge wave of illegal immigrants, most from Mexico (upwards of 5 million by 1980). Came to the U.S. as migrant farm workers and unskilled laborers.
Cuba About 800,000 refugees came from Cuba when Fidel Castro took over. President Jimmy Carter welcomed them with an “open heart and open arms”
Current Trends Today, the highest number of immigrants comes from Mexico and S.E. Asia The rate at which people have come to America has slowed, despite a record high number of foreign born residents
Current Trends In 2001, the U.S. government initiated a series of immigration policies under the Patriot Act that were designed to decrease the chance of another terrorist attack. This was renewed in 2005. By 2005, four states had non-white majority populations, California, Texas, New Mexico, Hawaii
Allowed the president the power to deport aliens that were deemed “Dangerous to the peace and safety of the United States”. President Adams never signed a deportation order, had little effect on Aliens in America Alien & Sedition Acts (1798) Excluded All Chinese from immigrating. Chinese immigrants already in the U.S. could not become citizens Chinese Exclusion Act (1882) https://www.mtholyoke.edu/acad/intrel/chinex.htm The Act excluded “skilled and unskilled laborers and Chinese employed in mining.” Legalized Discrimination!
Gentlemen’s Agreement of 1907 U.S.-Japanese informal agreement No new Japanese immigration in exchange for end to segregation in California • Introduced literacy tests Immigration Act of 1917 (Literacy Act)http://library.uwb.edu/guides/usimmigration/39%20stat%20874.pdf • Heavily restricted immigration from S+E Europe (New Immigrants) • Excluded the remainder of Asia.
Emergency Quota Act (1921) http://library.uwb.edu/guides/usimmigration/42%20stat%205.pdf Limited immigration to 3% of people from that country living in the United States. Based on 1910 census. (Established Quota System) Limited immigrants from Southern andEastern Europe + favored immigrants from Northern and Western Europe.
Immigration Act of 1924 http://tucnak.fsv.cuni.cz/~calda/Documents/1920s/ImmigAct1924.html Further restricted immigration from Southern and Eastern Europe (New Immigrants) • Based quota on 1890 census. • Quota reduced from 3% to 2%
National Origins Act Established quota as a total of 156,000 immigrants who could enter Further restricted all immigration