Download
1 / 19
190 likes | 376 Views
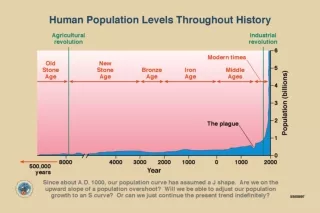
Population projections, purposes and software . ESRC Methods Festival 2006 Ludi Simpson, University of Manchester, CCSR. Why forecast population?. Scenarios for service planning – age/sex related Scenarios for socio-cultural change Local, national, world population change Derived forecasts

E N D
Population projections, purposes and software ESRC Methods Festival 2006 Ludi Simpson, University of Manchester, CCSR
Why forecast population? • Scenarios for service planning – age/sex related • Scenarios for socio-cultural change • Local, national, world population change • Derived forecasts • Housing, jobs, disability, waste disposal, recruitment targets, care homes, library usage, HIV, …
Why do it? No.2 • Population is increasing / decreasing, will it continue to do so? • Migration, natural change and age structure • How much housing will we need? • Household size, population, age structure
Which software is available? • In-house • ONS, GRO(S) • Local Authorities • POPGROUP • Excel, Do-It-Yourself data entry, see it working • Local Authorities and Universities • CHELMER • Own-format, standard datasets, ready packaged – oriented to England local authorities • Various overseas and UN packages • PRODEM, FIV-FIV and SIN-SIN, RUP
POPGROUP designPrinciples and practice • Single year of age, male/female, and any number of groups • Standard cohort component projection method • Excel input files • Excel output files • Macros do work of structuring files, validating data, projections and most interrogation • Easy start, then develop • the future is not what it used to be
Setting up POPGROUP Folders for Skeletons Input Output Labels for each area
Future popul-ation Base popul-ation Natural change Migration Each component of population change is one input file Pt+1 = Pt + B – D + IUK – OUK +IOV – OOV Seven input files, plus: Constraints : population, housing and employment Special populations (students, armed forces) Dwellings (vacancy, second homes, sharing households) Jobs (commuting, unemployment)
Each input file represents a collection of assumptions for one component
POPGROUPoperations STAGE 1 - SETTING UP THE MODEL BASICS You specify: groups, special populations, furthest forecasts, 2 migration areas. The model creates skeleton input files. STAGE 2 - PREPARING THE ASSUMPTIONS You specify: options, data, and documentation The model validates your data. STAGE 3 - FORECASTS You specify: scenario ≡ file locations; the model calculates the forecast STAGE 4 - USING THE OUTPUT Chart the results; extract summaries.
Ready data for input • Complete examples for teaching • Fluteshire county with two Districts • Single age fertility, mortality, migration rates • Government national projections; census for migration, • ONS POPGROUP datasets for local areas • DCLG household projections
Example of the impact of rates and counts on the Total Fertility Rate Total Fertility Rate Training phase 2. Age-trend on All-areas sheet, from GAD projections Forecasts 3. Each area’s differential, maintained in future 1. Each area’s counts of births
Output files and facilities • Detailed forecasts: each year, single age • Components, Summary, Dump files • Reporter – charts and tables Special effects • Components of change summary • Comparison of forecasts • Output for database/statistical analysis • Flying pyramids
Outputs • Output files allow, for example • Charter - pyramids • Flying pyramid • Comparison of forecasts
Housing plans and implications within POPGROUP output What’s the impact on population of planned housing developments? What’s the change in number of households and dwellings each year?
Support and user group • www.ccsr.ac.uk/popgroup • Training: Manchester two-day courses • Email discussion list • User group: chair, Janine Edwards, Conwy • Steering group • Teaching version free • Full version: £1,000 POPGROUP, £500 each HOUSEGROUP and LABGROUP