Download

1 / 26
260 likes | 403 Views
ICES/NAFO Symposium on the Variability of the North Atlantic and its Marine Ecosystems during 2000-2009 10-12 May 2011, Santander, Spain. Atlantic Water temperature and climate in the Barents Sea in 2000-2009 Vladimir Boitsov , Alexey Karsakov , Alexander Trofimov

E N D
ICES/NAFO Symposium on the Variability of the North Atlantic and its Marine Ecosystems during 2000-2009 10-12 May 2011, Santander, Spain Atlantic Water temperature and climate in the Barents Sea in 2000-2009 Vladimir Boitsov, AlexeyKarsakov, Alexander Trofimov Polar Research Institute of Marine Fisheries and Oceanography (PINRO) Murmansk, Russia
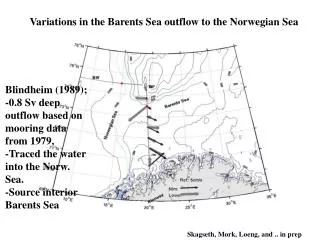
The main paths of Atlantic waters > 1100 times since 1900 2 Barents Sea
Decadal mean temperature in the 0-200 m layerin the Murman Current the highest since 1900 4.7°C warmer Atlantic waters 3 Barents Sea
Annual mean temperature anomalies in the 0-200 m layer in the Murman Current 0.5...1.2°C above average 2000, 2004-2009 anomalously high temperatures 2006 – historical maximum (1.2°С above average) +0.3°C (2003) 4 Barents Sea
Monthly mean temperature anomalies in the 0-200 m layer in the Murman Current – absolute maxima V VI VII VIII IX X Winter anomalies were higher than summer ones. 5 Barents Sea
Decadal mean air temperature anomalies around Bear Island Winter anomalies were higher than summer ones. Bear Island 2.2-2.4°C above normal (2006 and 2007) 6 Barents Sea
Ice coverage anomalies (May-July averaged) in the Barents seain 1900-2009 2000-2009 mean ice c. <1990-1999 mean ice c. by10% 2006 and 2007 annual mean ice c. was 22-23% less-than-normal 7 Barents Sea
Climate index for the Barents Sea TAir TWater AreaIce TAir-TAirTWater-TWaterAreaIce-free-Area Climate index = + + σTAirσTWaterσAreaIce-free Climate TAir at Vardø and KaninNos coastal stations TWater in the 0-200 m layer of the Murman Current AreaIcein May-July 8 Barents Sea
Cumulative curve of the climate index for the Barents Sea ↑TWater + ↑AreaIce-free = ↑Climate index 2006 1997-1999 ↓TA ↓TW 1929 1988 9 Barents Sea
Cumulative curve of the climate index for the Barents Sea 10 Barents Sea
Franz Josef Land - Novaya Zemlya section 2007 2008 PINRO IMR 11 Barents Sea
Temperature in the Franz Josef Land - Novaya Zemlya section in September 1991 1992 Surface and outflowing waters much warmer (2007-2008) 2008 2007 12 Barents Sea
Bottom temperature in August–September 2000 13 Barents Sea
Bottom temperature in August–September 2001 14 Barents Sea
Bottom temperature in August–September 2002 15 Barents Sea
Bottom temperature in August–September 2003 16 Barents Sea
Bottom temperature in August–September 2004 17 Barents Sea
Bottom temperature in August–September 2005 18 Barents Sea
Bottom temperature in August–September 2006 19 Barents Sea
Bottom temperature in August–September 2007 20 Barents Sea
Bottom temperature in August–September 2008 21 Barents Sea
Bottom temperature in August–September 2009 22 Barents Sea
Bottom temperature in August–September 51 <5-6% 31 4-5 >2°C 0-2°C <0°C 23 Barents Sea
Bottom temperature in August–September The lower T in the 150-200 m layer of the Kola Section in winter, the larger bottom area covered by water <0°C in Aug-Sep. Differences between 2007 values and max values since 1951 Anomalies in 2007 (the smallest area covered by water <0°C) 35% 94% 24 Barents Sea
Conclusions ● In 2000-2009, air and water temperatures in the Barents Sea were higher-than-normal throughout the years , with extremely high positive anomalies in some years. ● The last decade was the warmest one since 1900. ● The warming processes in the Barents Sea peaked in 2006-2007. In 2008-2009 the climate index almost halved. ● The decreasing trend in air and water temperatures in the Barents Sea is probably expected to continue into the nearest future, which will result in increased ice coverage. 25 Barents Sea