Download
1 / 25
250 likes | 475 Views
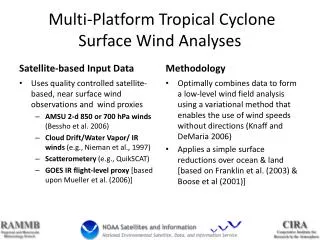
Improvements in Deterministic and Probabilistic Tropical Cyclone Surface Wind Predictions Joint Hurricane Testbed Project Status Report. Mark DeMaria NOAA/NESDIS/ORA, Fort Collins, CO John A. Knaff, Jack Dostalek and Kimberly J. Mueller CSU/CIRA, Fort Collins, CO

E N D
Improvements in Deterministic and Probabilistic Tropical Cyclone Surface Wind PredictionsJoint Hurricane Testbed ProjectStatus Report Mark DeMaria NOAA/NESDIS/ORA, Fort Collins, COJohn A. Knaff, Jack Dostalek and Kimberly J. Mueller CSU/CIRA, Fort Collins, CO Collaborators: Jim Gross (TPC), Charles Anderson (CSU), Buck Sampson (NRL),Miles Lawrence(TPC), Chris Sisko (TPC) Presented at The Inter-Departmental Hurricane Conference March 3, 2004 Charleston, SC
OUTLINE • Deterministic Intensity Forecast Improvements • Can inner core data from aircraft and satellite improve SHIPS forecasts? • Automated objective analysis and EOF analysis • Compare neural network and linear regression models • Probabilistic Surface Wind Forecast Improvements • Calculate operational track/intensity and wind radii-CLIPER error distributions • Randomly sample errors using Monte Carlo method • Generate probabilities of 34, 50, 64 and 100 kt winds
5 Basic Radial Profiles (Samsury and Rappaport 1991) 4 1 5 2 • Develop objective method for • extracting similar information • Supplement with inner-core • GOES data 3
Variational Wind Analysis for Aircraft Data • Combine 12 hours of recon data in storm-relative coordinates • Perform automated quality control • Analyze data to determine if coverage is sufficient • Designed to measure at least azimuthal wavenumber 0 and 1 • Compare data to “pre-analysis” to eliminate bad points • Perform “variational” analysis to provide u,v on radial, azimuthal grid • azimuthal smoothing >> radial smoothing • Based on Thacker and Long (1988) • Preliminary prediction based upon azimuthal average tangential wind
AF Recon Flight Level Winds for Hurricane Lili Earth-Relative 10/02/02 0000-1200 UTC
AF Recon Flight Level Winds for Hurricane Lili Storm-Relative 10/02/02 0000-1200 UTC
Variational Wind Analysis for Lili 10/02/02 0000-1200 UTC
Isotachs (kt) from Variational Wind Analysis for Lili 10/02/02 0000-1200 UTC
Isotach Analyses for Hurricane Lili 10/01 0000 UTC – 10/03 1200 UTC
Azimuthally Averaged Tangential Wind (r=0 to 200 km) Hurricane Lili 10/01 00 UTC to 10/03 12 UTC
Comparison of Best Track and Variational Analysis Maximum Wind(1995-2002 Cases)
EOF Analysis • ~400 cases with recon and IR data (95-03) • 51 radial grid points, r = 4 km • How to relate 102 IR and wind values to intensity change? • Empirical Orthogonal Function (EOF) Analysis • Mathematical technique for extracting common patterns from datasets • Apply to tangential wind and IR radial profiles • Work with small set of patterns instead of the entire profiles
Variance Explained by each EOF Tang. Wind: 99% w\ 6 EOF IR Brightness T: 99% w\ 4 EOF
Tangential Wind and IR EOFs Tang. Wind 1-3 Tang. Wind 4-6 IR 1-4
Part 1 Project Schedule • Spring 2004: Develop statistical intensity model using EOF amplitudes • Provide adjusted SHIPS forecast based upon inner core information • Spring 2004: Compare neural network and regression techniques • Collaboration with Dr. Charles Anderson, CSU Computer Science Department (Expert in Machine Learning Techniques) • Summer 2004: Implement variational aircraft analysis at NHC/JHT • Summer/Fall 2004: Test results on real-time forecasts
Preliminary Neural Network ResultsDependent data test with 1989-2002 Sample
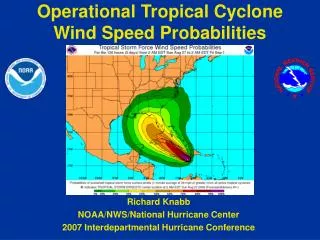
Monte Carlo Model for Tropical Cyclone Surface Wind Probabilities(Initial support from Insurance Friends of the National Hurricane Center) • Calculate NHC track and intensity errors (along track and cross track) from multi-year sample • Determine large set of tracks and intensities (realizations) centered around official forecast by randomly sampling from error distributions • Estimate wind radii distributions from errors of radii-CLIPER model • Calculate probabilities by number of times specified point comes with radii of specified wind speed relative to total number of realizations • Run in real-time in 2003 season (starting August)
Monte Carlo Wind Probability Model Example: Hurricane Fabian Aug 31 2003 18Z Vmax=115 kt R34 100 75 75 100 R50 30 30 30 30 R64 20 20 20 20
Modifications based on 2003 Results • Model Changes • Improved portable random number generator • Complete error field sampling (instead of 1-99th percentiles) • Modified for use in the Atlantic, East/Central Pacific, and western North Pacific basins (i.e., Longitude … 0-360) • Option for 100 kt radii added for JTWC • Error Components • Improved radii-CLIPER model • Inclusion of initial wind radii asymmetries • radii match observed at t=0 hr • R34 bias correction • Intensity errors account forecast intensity and distance to land • Distributions being updated with 2003 cases
Impact of Model Changes (Fabian 2003 Example) Old New
N=500 N=1000 Sensitivity to the number of realizations N=2000 N=500000
R34 R50 Typhoon Maemi 9/9/04 06 Z Vmax=115 kt R34 130 130 130 130 R50 50 50 50 50 R100 20 20 20 20 N=2000 R64 R100
Part 2 Project Schedule • Spring 2004: Investigate variable grid options • Improve efficiency and for NDFD applications • Spring 2004: Finalize probability model for 2004 season • Summer/Fall 2004: Run at NHC in real-time for Atlantic and East Pacific cases • Summer/Fall 2004: Coordinate with JTWC for real-time tests (directly on their ATCF) • Winter 2004: Evaluate results from 2004 runs • 2004 “Freebie”: Provide NHC and JTWC with updated Radii-CLIPER models