Download
1 / 11
110 likes | 119 Views
This report provides updated projections and estimates of enrollment and degree awards by public institutions in Virginia. It outlines recent trends, progress towards set goals, and key conclusions. The focus is on tracking the achievement of TJ21 and Virginia Plan objectives by the designated timelines.

E N D
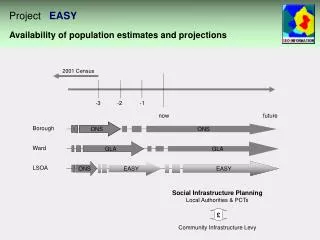
Enrollment Projections and Degree Estimates of Public Institutions Update to Resources & Planning Committee
Background and Summary • Staff worked with institutions to streamline projection model and reduce burden. Part of this effort limited the enrollment projections and degree estimates to four years instead of six. • In the Fall of 2016, public institutions met 97% of projected enrollment. • For the academic year 2015-16, institutions awarded 105% of the degrees estimated for that year. • To date, we have awarded 24,884 cumulative additional undergraduate degrees to instate students and are on track to achieve 115,220 for the TJ21 goal (beginning 2010). • To date, we have awarded a total of 176,104 undergraduate degrees and certificates towards Commonwealth’s goal of 1.5 million awards (beginning 2015).
Recent HS Grads, FTIC Despite an increase of 1,368 Advanced Diploma graduates and 1,865 Standard Diploma graduates, enrollment of new First-Time in College students remained flat, compared to last year.
TJ21 Measurement and Progress Cumulative Additional Associate and Bachelor’s Degrees from Public Institutions by 2025
Conclusions • Institutional enrollment projections remain conservative. • Degree estimates return to the more positive and aggressive approach we saw in 2013. • Staff is confident that the Commonwealth public institutions are on track to meet the goals of both TJ21 and the Virginia Plan.