Download
1 / 14
140 likes | 159 Views
Explore influence of geometric heterogeneity on fault rupture behavior through DEM modeling. Study stick-slip dynamics, stress distribution, and synthetic seismograms for insights.

E N D
DEM Simulation of dynamic Slip on a rough Fault Steffen Abe, Ivan Lokmer and Chris Bean Seismology and Computational Rock Physics Lab University College Dublin Ireland
Project ScopeDEM Simulation of Rupture Processes Key Question: • Influence of geometric heterogeneity on rupture behavior of a fault model Approach: • DEM fault model • Geometric heterogeneity on two scales • Simple friction law
The DEM Approach • Spherical particles interacting with nearest neighbors • Brittle-elastic “linked” interactions • Can break if deformed too far • Free elastic interactions • Frictional interactions • Coulomb friction
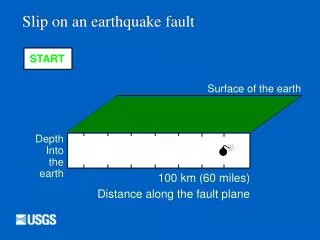
The Fault Model (I) • 1D fault embedded in 2D elastic block • smooth and rough patches along the fault surface -> “large scale” roughness • constant normal force and shear velocity at the edge of the elastic block
The Fault Model (II) 375…400 particles long 200…300 particles wide Narrow band of random sized particles along fault to generate random “small scale” roughness
Stick-Slip Dynamics of the Fault Slow stress/energy buildup Stress drop at slip events Used to identify major slip events
Slip distribution Inhomogeneous final displacement both uni- and bidirectional propagation displacement time location along fault
Pre-Slip Stress and Final Slip Distribution high displacement in “low stress deficit” / “close to failure” regions slip stopped by “far from failure” asperity
Synthetic Seismograms two different approaches, both using displacement evolution recorded at the fault surface analytic extrapolation, assuming ideal elastic medium (I. Lokmer) numerical (DEM) compare results from the two methods for verification
Synthetic Seismograms – Verification (I) data high pass filtered, adjusted for “best fit” velocity in DEM main features agree differences in details Reasons: limitations of DEM used wave speeds are freq. dependent limit on frequency finite model
Synthetic Seismograms – Verification (II) Data band-pass filtered and scaled to fit main features good agreement in most features
Synthetic Seismograms – Setup arbitrary locations possible 14 intermediate to far field locations chosen distance 1.5-15 times fault length
Conclusions / Outlook • Complex rupture patterns generated by geometrically heterogeneous fault with simple friction law • Rupture extent influenced by pre-slip stress deficit/ closeness to failure • Next ? 3D !