Download
1 / 12
120 likes | 226 Views
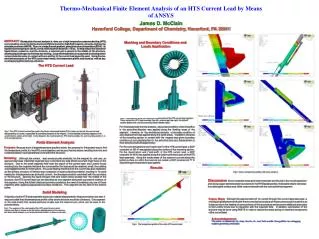
Preliminary thermo-mechanical analysis of the LH antenna front. Laurent Marfisi and Marc Goniche CEA. IRFM. F-13108 Saint-Paul-lez-Durance. France HCD08-03-01 EFDA Task Meeting in Frascati. 31 March-1 April 2009. LH PAM Antenna dimensions. Taken from DDD2001 (Ph.Bibet & F.Mirizzi)

E N D
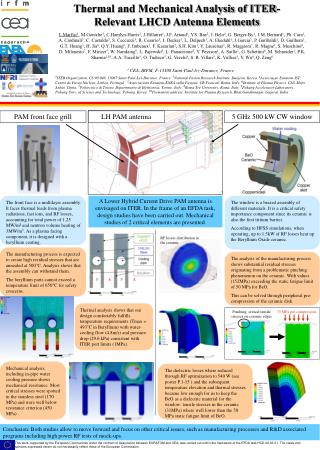
Preliminary thermo-mechanical analysis of the LH antenna front Laurent Marfisi and Marc Goniche CEA. IRFM. F-13108 Saint-Paul-lez-Durance. France HCD08-03-01 EFDA Task Meeting in Frascati. 31 March-1 April 2009
LH PAM Antenna dimensions • Taken from DDD2001 (Ph.Bibet & F.Mirizzi) • Wall thickness : e= 13.25mm • Passive WG length : L=15mm • Cooling channel : F=8mm • Distance between cooling channels in the structure: 62.5 mm
Heat Fluxes • Nuclear volume heat source 5MW/m3 (pessimistic ICRH antenna 3MW/m3). e-fold decay lQ= (pessimisticlQ ~0.10 m from ref.2) • Plasma Radiation : 0.15 MW/m2(see next)on the whole surface facing the plasma (pessimistic=> shadowing effect) • Fast ion Flux from plasma : 0.5MW/m2 (pessimistic, see ref.3) • RF losses : 13 kW/m2 for copper, 28 kW/m2 for Beryllium Cooling water (ITER specifications): Tin=10015°C.Tout<148°C Berylllium (ITER specifications): Tmax<385°C [2] NUCLEAR ANALYSIS REPORT (NAR). G 73 DDD 2 W 0.2. p19-20 & 24 [3] dB/B=0.3% (Magnetic inserts): 0.1MW/m2. (Kramer et al. IAEA2008)
Radiation flux Radiated flux from the plasma (scenario 5): - 70MW/683m2=0.10MW/m2 - Pa+Pinj=175MW Prad/Ptot=0.7 => Prad=122.5MW Prad.vessel/Prad.divertor=0.3=> Prad.vessel=37MW => 37/683=0.05MW/m2) : 0.15 MW/m2 is an upper bound
Extracted power per antenna front unit (L=1.9m) 35.4kW &Tmax=148°C V=5.8m/s
Temperature mapping Twater=125°C Tmax=325°C Twater=148°C Tmax=350°C (with V=5.8m/s)
Temperature mapping Shorter Beryllium part (Twater=148°C, V=5.8m/s) Tmax=334°C
Temperature mapping Fions=0.3MW/m2 (instead of 0.5) Frad=0.15MW/m2 on reduced length (15mm instead of 18mm) (Twater=148°C, V=4m/s) Tmax=312°C
Stress mapping Fions=0.5MW/m2 Frad=0.15MW/m2 (Twater=148°C, V=5.8m/s) Ymax=124MPa
Stress mapping (zoom of the HIP joint, fine mesh) • High stress zone is very small and will be deformed plastically • Stress field is smoothed • Ymax ~ 80MPa ( < Stress limit of the joint) • To be checked with a non-linear model
Future work (for next working meeting) • Optimize with new geometry (N//0, bpassive/bactive) • Non-linear calculation of the stress • 3D modelling with full Be waveguides