Download
1 / 22
220 likes | 296 Views
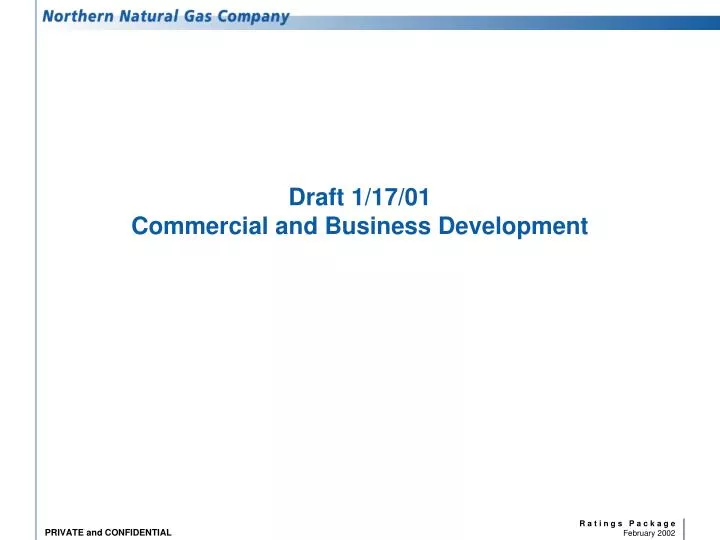
Draft 1/17/01 Commercial and Business Development. Western Canadian Basin. Montana. Minnesota. North Dakota. Michigan. Wisconsin. South Dakota. Wyoming. Rocky Mountain Basins. Nebraska. Market Area. Iowa. Illinois. Kansas. Hugoton Basin. Supply Area. Missouri. Oklahoma.

E N D
Western Canadian Basin Montana Minnesota North Dakota Michigan Wisconsin South Dakota Wyoming . Rocky MountainBasins Nebraska Market Area Iowa Illinois Kansas Hugoton Basin Supply Area Missouri Oklahoma Anadarko Basin New Mexico Permian Basin Storage Locations Texas Gulf Coast System Map • 16,500 Miles • 4.3 Bcf/d Market Area Peak • 2.0 Bcf/d Field Area Deliveries • 59 Bcf Storage
Gas Demand Growth 2000 - 2005 Increase (Bcf) North Central North Central Region: ND, MN, MI, WI, SD, IA, IL, IN, OH, NE, KS, MO 547 North Central New England New England 547 California/ California/ 219 219 Pacific Northwest Pacific Northwest 548 548 South Central South Central Mid Atlantic Mid Atlantic 146 146 292 292 Total U.S. Total U.S. South Atlantic South Atlantic 2,665 2,665 694 694 Southwest Southwest Other Other Other Other 219 219 Gas Gas Gas - - - Fired Fired Fired Generation Generation Generation Source: WEFA, Cambridge Energy, Enron Corp., Industry and Analyst Publications Northern Natural Gas Pipeline
Market Area • NNG’s pipeline in the Market Area was built primarily as a delivery system integrated with the facilities of Local Distribution Companies with over 2,000 delivery points. This grid system is expensive to duplicate by competing parties. • Growth of natural gas usage by LDC’s in the Market Area is 1-2% per year. • Additional growth is expected with new construction of power and ethanol plants.
Market Area Competitors • Major competitors in the Market Area: • Alliance • ANR Great Lakes • Natural Gas Pipeline • Northern Border • Trailblazer • Viking
Traditional Market Area - Competitive Threats • Minnesota – Stable earnings through 2007. • Iowa – Lower value due to competing pipelines, but stable through 2005. • Wisconsin /Chicago – At risk in 2003. Market prices are below max tariff rates due to high concentration of competing pipelines. Great Lakes ANR Alliance Northern Border Competitive Threat Areas
South End System • Built to connect traditional market area with MidContinent and Permian supply regions. • NNG is a transporter in the national pipeline grid with connections to multiple supply basins and interconnecting pipelines. • Short term contracts. • Wider Customer Base • Bi-directional flows
Market Growth Strategies Western Canadian Basin • Project MAX: Market Area Expansion (See detail page 20) • Capture growth with minimal capital requirements • New gas fired power plants • Interconnect expansions for Market and Supply areas • Estimated demand growth is 1-2% Montana Minnesota North Dakota Michigan Wisconsin South Dakota Wyoming Market Area . Rocky MountainBasins Nebraska Iowa Illinois Kansas Hugoton Basin Supply Area Missouri Oklahoma Anadarko Basin New Mexico Permian Basin NNG Assets Texas Storage Northern Natural Pipeline Major Pipeline Interconnects Great Lakes Viking Northern Border Trailblazer
Supply Sources Ample supply access to serve Major Utilities and Industrials in the Upper Midwest
Western Canadian Basin Montana Minnesota North Dakota Michigan Wisconsin South Dakota Wyoming Market Area Rocky MountainBasins Nebraska Iowa Supply Area Illinois Kansas Hugoton Basin Missouri Oklahoma Anadarko Basin New Mexico Permian Basin Texas • Source WEFA, INC Natural Gas Outlook 2001 Supply Area Trends
Number of Customers by Type Based on 12/2000-11/2001 Production Months
Percent of Total Revenue by Customer Type Based on 12/2000-11/2001 Production Months
Contract Structure • Long Term contracts (TF) are typically held by LDC customers to serve residential, commercial and industrial customers behind the city gate. These contracts are primarily made up of annual and winter-month service periods. Long term contracts are typically executed in groups during rate case cycles. Customers holding long term contracts are predominately captive to the NNG system and pay maximum rates. • Short Term contracts are typically for daily and monthly periods (TF, TFX, TI). These contracts usually fill the need for marketing and producer groups to move gas on a short term basis. The customers are predominately non-captive and purchase transportation based on price spread opportunities over one or two seasons.
Contract Structure Rate Schedule Description Typical Use TF Firm Throughput Service Used primarily by LDC markets made up of residential, commercial and industrial users. TFF is a service available for receipt in the Field Area and delivery to the field/market demarcation point. Available for Field and Market Areas with flexibility in term length TFX Firm Throughput Service and monthly/seasonal quantities. Used primarily for short term firm transportation. TI Interruptible Throughput Service Available for Field and Market Areas on an interruptible basis. GS-T Firm Throughput Service - Available for Market Area Small Customers with daily firm Small Customer entitlement of 5,500 mcf or less. SMS System Management Service - Available as a companion service to Firm Throughput Service and No Notice Service provides no-notice firm delivery. FDD Firm Deferred Delivery - Available for firm storage services. Provides shipper the ability to Storage Service have natural gas transported to or received from Northern on a deferred basis. IDD Interruptible Deferred Delivery - Available year-round for interruptible storage services. Provides Storage Service shipper the ability to have natural gas transported to or received from Northern on a deferred basis.
Firm Transport - Market 80% Demand 84% Storage 11% Commodity 16% Firm Transport - Field Interruptible Transport - Field 7% 1% Interruptible Transport – Market 1% Revenue Sources
Currently Under Contract Expiration Dates for Reservation Revenues Contract Year Basis Currently Under Contract Contract Year Basis 160 $141.5 140 $130.5 $ 95.0 Million Market Value 120 100 80 millions $ 60 $30.4 40 $20.4 20 $10.9 0 2003-4 2004-5 2005-6 2006-7 2007-8 Market Field Storage 2003 FDD: 22 Customers; 28 BCF Transport: 72 Customers; 1.6 BCF/D
Contract Year % of Revenue 2002-2005 45% 2006-2010 51% 2010-2013 3% Rollover/Evergreen 1% Top 10 Shippers – Transportation Revenue Top 10 - Expiration Data Note: For the Accounting Months of December 2000 through November 2001 Top 10 Customers represent 69% of total revenue for this time period.
Historical Breakdown of Transport RevenueFirm/Interruptible • Notes: • Source: Commodity/Demand Margin Reports • 2000 had increase in So Onshore due to volatility. • 1999 had a one-time increase due to Seasonal Rates. • 1998 was 16% warmer than previous year.
Seasonality – Revenue/Volume Source: MFE
Project MAXMarket Area eXpansion • Volume requests received during Open Season = 368,500 MMBtu/d • Traditional growth = 176,500 • Electric generation = 192,000 (96,000 is uneconomical and will not be pursued) • Traditional growth is approximately a 4% increase in NNG’s current peak day market. • Requested volumes are staggered over a six-year period beginning in 2002 with the largest percent to begin in 2003. • Customer meetings are currently in progress • Precedent Agreements to be completed in February 2002 • FERC filing scheduled to be filed prior to August 2002 • Construction to begin Spring 2003
Power Plant Expansions Cottage Grove Cogentrix 240 MW 34,000 MMBtu/d-F (1997) Xcel 1035 MW 135,000 MMbtu/d-F/I (2003-9) Inver Hills NSP Generation 343 MW 70,000 MMBtu/d-I (1999) Pleasant Valley Great River Energy 445 MW 82,000 MMBtu/d-I (2001) • Black Dog NSP Generation 225 MW 35,000 MMBtu/d-I (2003) • • Whitewater Cogentrix 240 MW 30,000 MMBtu/d-F (1997) Wisdom Corn Belt 85 MW 16,000 MMBtu/d-I (2004) • • Salt Valley Lincoln Electric 159 MW 24,000 MMBtu/d-F (2003) • • • Alliant 800 MW 110,000 MMBtu/d-F/I (2003-4) NPPD 250 MW 36,000 MMBtu/d-F (2005) Cass County OPPD 330 MW 67,000 MMBtu/d-I (2003) Pleasant Hill MidAmerican 770 MW 180,000 MMbtu/d-F/I (2003-5) • Recent Plants Proposed Plants • Potential additions of 737,000 Mmbtu/d • Additions represent about 200% of current connected gas fired generation. • Source: NewGEN and PowerDAT, 2002
Big Stone Millbank, SD 1,500 MMBtu/d Agri Energy Luverne, MN 1,200 MMBtu/d Rosholt 1,800 MMBtu/d Sioux Center IA 1,600 MMBtu/d (9/01) Granite Falls, MN 3,000 MMBtu/d Heartland Corn Winthrop MN 1,500 MMBtu/d Al Corn Clean Fuels Austin, MN 1,500 MMBtu/d Galva, IA 2,400 MMBtu/d (12/01) Wentworth, SD 5,300 MMBtu/d Pro Corn LLC Preston, MN 1,500 MMBtu/d Little Sioux, IA 4,500 MMBtu/d (2002) Columbia County, WI 3,000 MMBtu/d • • • • Monroe, WI 4,000 MMBtu/d Earlville, IA 2,000 MMBtu/d Minnesota Corn 13,000 MMBtu/d Denison, IA 2,400- 3,250 MMBtu/d Hardin County, IA 3,000 MMBtu/d Coon Rapids, IA 4,750 MMBtu/d (2002) • • Potential additions of 58,000 Mmbtu/d • Seven additional plants at confidential locations are being considered. (40,000 MMBtu/d Total.) • Estimated 75% increase in ethanol production over the next two years. (California Energy Commission) Plants Being Built Proposed Plants - Existing Direct Connects Ethanol Plant Expansions