Download
1 / 11
110 likes | 287 Views
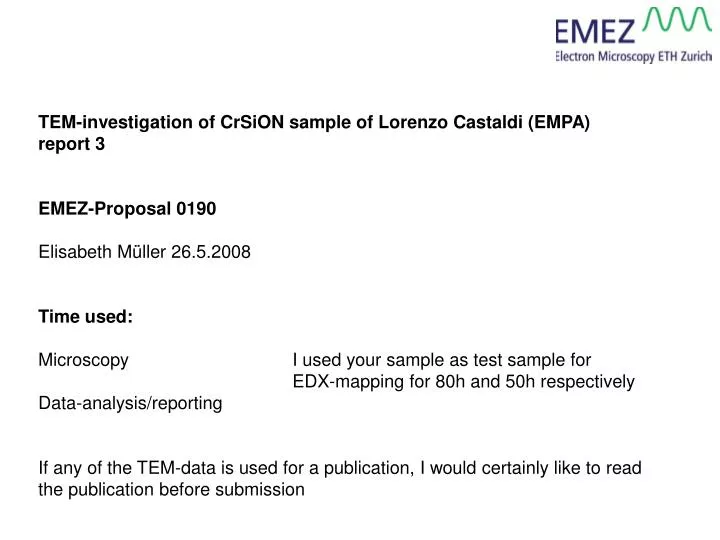
TEM-investigation of CrSiON sample of Lorenzo Castaldi (EMPA) report 3 EMEZ-Proposal 0190 Elisabeth Müller 26.5.2008 Time used: Microscopy I used your sample as test sample for EDX-mapping for 80h and 50h respectively Data-analysis/reporting

E N D
TEM-investigation of CrSiON sample of Lorenzo Castaldi (EMPA) report 3 EMEZ-Proposal 0190 Elisabeth Müller 26.5.2008 Time used: Microscopy I used your sample as test sample for EDX-mapping for 80h and 50h respectively Data-analysis/reporting If any of the TEM-data is used for a publication, I would certainly like to read the publication before submission
I made a test with EDX-mapping and used the CrSiON sample for this. Two of the maps were at lower, one at higher resolution. The former ones for the chemical distibution around two of the big „balls“ and one for the composition modulation. The times used for the mappings were up to 80 hours measuring time at the Tecnai F30.
Problem: EDX-mapping on Tecnai F30 Windows as defined for the mapping Problems: N, Si, O ↔ signal to noise ratio O ↔ Cr-L lines extremely near Energy windows as chosen for the EDX-mapping: N-K: 0.344 - 0.427 eV O-K: 0.5182 - 0.5358 eV Si-K: 1.638 – 2.863 eV Cr-K: 5.257 – 5.578 eV
CrSiON: faults in the layer with big balls (low magnification) and concentration modulation (higher magnification)
Very low-magnification EDX-map • small window: used for drift correction • large window: area chosen for the map • ball = Cr-rich area with possibly some Si • area below the ball = Si-rich area Cr-rich Si-rich Cr-K map N-K map O-K map Si-K map
Low-magnification EDX-map • small window: used for drift correction • large window: area chosen for the map • size: 256 x 256 pixels = 1532 x 1532 nm • measuring time per pixel: 4“, total time 80h • area per pixel: 6 x 6 nm2 • ball = Cr-rich area with possibly some Si • area below the ball = Si-rich area Cr-rich Si-rich Cr-K map N-K map O-K map Si-K map
High-magnification EDX-map • small window: used for drift correction • large window: area chosen for the map • size: 190 x 190 pixels = 236 x 236 nm • measuring time per pixel: 4“, total time 50h • area per pixel: 1.24 x 1.24 nm2 • black and white: windows chosen • colored: automatic routine • (190 x 190 pixels, 50h) Cr-K map N-K map O-K map Si-K map
N-K O-K Si-K_highpass filtered Cr-K Magnified images of the area marked in the above Cr-map
EFTEM • Cr and N: maxima and minima at the same positions. Therefore only one of these elements is compared to the others. O-blue_N-yellow • O and N (resp. Cr): maxima and minima just exchanged. Gray areas besides blue lines and between yellow lines contain all three elements: Cr,N,OThe O-N EDX-map nicely confirms the EFTEM result. The main difference is, that the EFTEM result shows a better resolution than the EDX-map, as a slight splitting of the weak blue maximum appears to be split, which is not visble in the EDX-map. EDX Si-turquoise_N-red • Si and N (resp. Cr): maxima and minima of the Si is shifted slightly towards sample surface as compared to N and Cr. Sample surface • Si and O: maxima of the Si is shifted slightly towards sample substrate as compared to O. O-green_Si-rose
Cr Cr Cr Cr HAADF STEM image acquired with small spot size Si Si Si Si STEM image acquired during EDX-mapping • Summary: • Concentration maxima • N = Cr (double maximum with a small minimum in between and separated by a strong minimum) • O = -N (always one strong maximum followed by a weak one) • Si: maxima always between the top side of N/Cr-maximum and the bottom side of the O-maximum top bottom