Download
1 / 28
280 likes | 516 Views
PACT WP5 - Modelling Example of possible evolutions in the POLES model. Mid term meeting Bruxelles – 17/05/2010 Philippe MENANTEAU, Paolo AVNER. WP 5 Modelling. Partners : LEPII, Enerdata

E N D
PACT WP5 - Modelling Example of possible evolutions in the POLES model Mid term meeting Bruxelles – 17/05/2010 Philippe MENANTEAU, Paolo AVNER
WP 5 Modelling • Partners : LEPII, Enerdata • Objective : Development of existing modelling tools in order to be able to reflect key drivers towards PC society as identified in other WPs • Task 5.1 up grading of VLEEM (NRD) • Improvement of data bases (urban mobility, urbanisation) – adaptation of the model structure (different urban schemes) • Task 5.2 up grading of POLES (LEPII) • Illustrate new adaptation margins, provide more realistic techno economic evolution profiles under high emission reduction scenarios • Task 5.3 linkage POLES – VLEEM (NRD) • Construction of a formal interface between VLEEM results and demand functions of POLES
Content • Objectives of WP5, the POLES model and its limits • Urban form and transport modelling • Residential modelling: ways forward
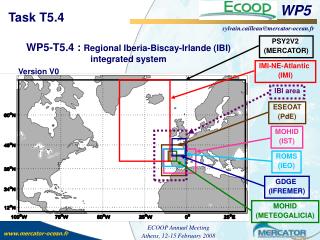
Resources Technologies Technologies Emission Constraint Emissions Emissions Cons, Prod Cons, Prod POP GDP The POLES model year-by-year recursive simulation process 57 Regions
Present evolutions in the POLES model • Situation : • Global energetic model ; large regions ; not spatialised • The urban dimension is not taken into account : consumption paths (buildings, transport), or infrastructures (energy networks, transport …) • Aim : • Simulate the impact on consumption of different urban dynamics (rapid urbanisation, megalopolis, densification vs sprawl, slow/accelerated retrofitting, new urban vehicles, building-transport integration, …) • Project : • Introduce the urban dimension and the density variable for more realistic energy consumption / emissions trajectories, noticeably in high constraint scenarios
Content • Objectives of WP5, the POLES model and its limits • Urban form and transport modelling • Residential modelling: ways forward
Urban pattern is very different from one region to another • Introduction of the distinction urban / non urban in the model: • A simple but insufficient answer • All cities are not equivalent from a demand/supply of transport perspective • Cf american cities / asian cities Importance of the density variable
Urban density has some connection with energy demand : ex of transport infrastructure
Relation between mobility VP (PKM) and urban density Total mobility regressions Private mobility as a function of density Source : Millenium database (UITP)
Establish a relationship between mobility demand and density • An inverse relationship exists between energy consumption for transport and density • Car equipment rate rises as density diminishes • Travelled Pkm rise as density diminishes • Density favours access to and use of public transport • Of course, detailed analysis show that transport and density have a more complex relationship (activity mix, urban forms beyond simple density, etc) • However possibility of using density as a proxy in a global energetic model (not a transport model, not a spatialised model) • Potentialities : • Simulation of the impact on mobility demand of urban sprawl (BAU)
Density Central POP Peri POP Distance Modelling logic Disaggregation of total population in 3 classes in order to account for their specific mobility demands URB POP Total POP RUR POP Transport Supply
Modal shares : relation between density and mobility modes Total pkm per capita (all modes) Modal shares Total = 100% Slow modes Cars Public transport Non – urban Périphery Centre Density
Introducing Urban centre and urban periphery in the POLES model Asia Europe U.S.A • Density gradients • A tool to introduce the urban sprawl dimension
Urban forms: Method for representation and distribution criteria Classical function for describing urban form (Clark, 1951) D(u) = D0eγu+ ε Ex: Toulouse 100 hab/ha 100 hab/ha
Modelling: Distributing PKM databases Econometric relationship Total Data Calculations PKM/cap par zone Urban periphery Extra-Urban Urban center Urban centre: CAR Urban periphery: Public transport Extra Urban : CAR Urban centre: Public transport Urban periphery: CAR Extra Urban: Public transport
Content • Objectives of WP5, the POLES model and its limits • Urban form and transport modelling • Urban form and buildings
What are the main relations between energy demand in buildings and urban density ? • Energy consumption is higher in individual houses (per m²) compared to collective buildings (compactness / contiguity effect) • High density generates heat island effects and higher demand for AC • Living surface is reduced in high density areas (land price) • Higher density of energy demand is more favorable to network energy of energy sources • Lower density (ind. Housing) facilitates access to dispersed energy sources
1. Agglomeration positively influences energy demand for buildings • Heat energy demand for buildings decreases with density • the agglomeration effect allows a decrease in heat losses (ie energy demand for heating / cooling) with increasing compactness, heigth. Detached Heat losses may be decreased by 30 % when a building goes from 1 to 3 levels Appartment
1. Bis. Agglomeration positively influences energy demand for buildings • GHG emissions per m² are influenced by climate zone but also by building types (single, multi family, high rise) Nemry et al., 2010 : Life cycle impacts (construction, use and demolition) of building types (new buildings in blank) -
1. Ter. Agglomeration positively influences energy demand for buildings • ETHEL study confirms the negative relation between density and energy demand (CO2 emissions as a proxy) for buildings • But situation may be different in 2030 • Limited difference between urban centre and periphery • Influence of density is much more important for transport than heating
2. Heat island effect and air conditioning • Demand for AC is expected to increase with climate change • It is not yet but it will be integrated in the POLES model. • Question : is there a relation between demand for AC and density? • Yes : needs for AC appear first in dense cities (heat island effect) • No : heat island effect has also reverse effects on heat demand • Conclusion : Heat island effect generates additional AC demand but the net effect (reduced heat demand also) is not that important
3. Other determinants than compactness may be important : living surface • Area per inhabitant may be the most influent factor on energy demand for buildings (much more than agglomeration effect) • Gap in surface per cap between individual and collective housing is significant and increasing (France ?) • Surf / cap is decreasing with increasing size of urban area (id)
4. What about district heating ? • Density of demand • higher energy density allows network supply with efficient or renewable energy production (ie combined heat and power – clean biomass combustion – “waste combustion” etc) • What if very low energy buildings ? • High rise and compactness produce higher energy density but ambitious thermal regulations goes in the opposite sense (reduction of energy demand / m²) • What is the economic future of district heating in a city with a high share of very low consumption buildings ? • Conclusion : no introduction of DH in POLES • a lot of work • Is it relevant to assume a development of DH ? Needs further detailed analysis.
5. bis. Access to dispersed renewable energy sources • Individual housing (ie low density) facilitates the access to dispersed renewable sources • POLES Status : Decentralised PV • Solar energy potential is estimated as a function of new and refurbished buildings (share of m²) • But no distinction is made between the types of buildings according to heigth (ie add m² in high rise building or ind. house is equiv) • POLES evolution : • Estimation of access to solar resource according to effective roof surface • ie. according to type of buildings (IND / COLL) or density
6. Dense vs sprawled cities : no clear model of sustainable city Density Dense cities: less heating (surf / cap effect) ! Sprawled cities: more area for dispersed renewable solutions ? Energy demand Renewable Energy production
Conclusion : work perspective • Introduction of urban density in the model • done • Transport : mobility and modal share as a function of density • Calibration in progress • Buildings : energy needs and density ? • Identification of key factors (done to be validated) • Identification of data sources (share IH/CB, heigth, … to be done)