Download
1 / 21
210 likes | 223 Views
Develops a model to describe and simulate traffic in the Bonn Agreement Area for accident prediction. Includes AIS data analysis, route definition, vessel movement capture, and future traffic forecasting to assess risks.

E N D
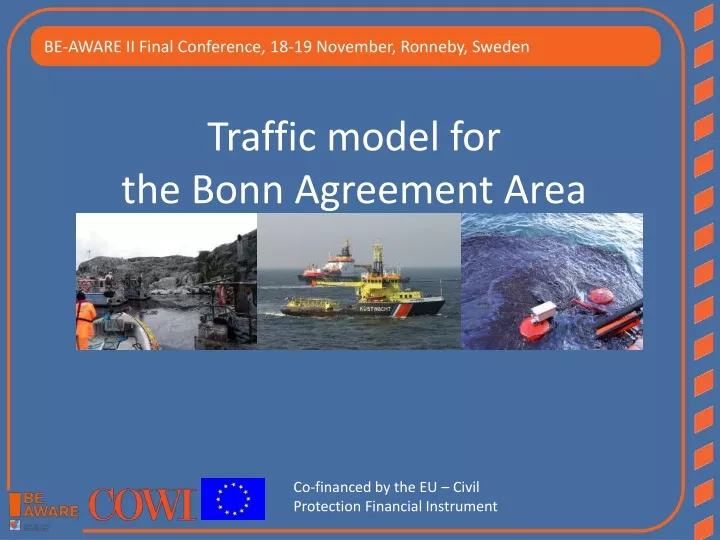
BE-AWARE II Final Conference, 18-19 November, Ronneby, Sweden Traffic model for the Bonn Agreement Area Co-financed by the EU – Civil Protection Financial Instrument
Overall objective: To develop a model that describes the traffic in the area This is later applied with the cargo model to simulate accidents and consequences Accident type Location Spill size Spill substance Basis: AIS data IHS Fairplay (representative ships) Traffic Analysis BackgroundTask H Traffic Analysis
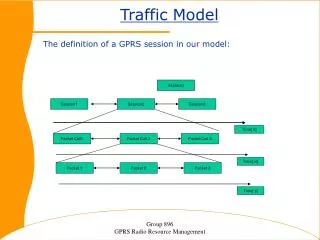
AIS data Definition of route net Idealised traffic Obstacles to be treated Areas with no/low AIS coverage or missing data Middle of North Sea German Bight Other fallouts Future traffic Traffic Analysis BackgroundProcess
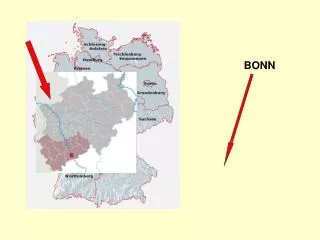
Traffic Analysis BackgroundProject area and sub regions:1: Atlantic2: Northern North Sea3: Eastern North Sea4: Southern North Sea5: Channel
- Period 2011 - The true traffic - Local differences Traffic Analysis AIS basis
- Clear routes are used TSS Reefs/shallow water Vessels take the shortest journey Traffic Analysis AIS basis
- Various vessel types Traffic Analysis AIS basis Only offshore No offshore or fishing
10000 routes Traffic Analysis Route Net
Traffic Analysis Idealised traffic
For every route Representative vessels using route Mean value Standard deviation Traffic Analysis Idealised traffic
What do we want do capture: Actual movement of vessels Harbour to harbour combinations Traffic Analysis Idealised traffic
North sea and German Bight General approch Closure of gaps of up to 36 hours except vessels at the area around Kiel Canal Closure of all <23 hours gaps Manuel correction of the number of vessels on the routes in the German Bight based on Accseas project traffic. Traffic Analysis Areas with low coverage
The individual vessel is followed Routes are closed by algorithm finding the shortest path Routes begins and ends at harbours Traffic Analysis Areas with low coverageProcedure
What do we have in our traffic model: Actual movement of vessels Harbour to harbour combinations For every route: Vessel information Type Size Distribution From/to port Traffic Analysis Idealised traffic
How do we apply this later: Traffic Analysis Idealised traffic + Traffic model Cargo model
Changes caused by: Windfarms New TSS Traffic Analysis Route Net 2020
Changes caused by: Windfarms New TSS Traffic Analysis Route Net 2020
Make new route net Identify ships affected Identify alternative route + Future traffic changes Changes in the size of vessels Changes in the number of voyages Traffic Analysis Idealised traffic 2020Process
Routes affected by wind parks New TSS routes implemented New tracks have been found for all vessels affected Prognosis implemented by adjusting 2011 traffic. Traffic Analysis Idealised traffic 2020
Traffic based on current situation 2011 Best estimate of future traffic based on adjusted tracks, sizes, voyages of vessels Port-to-port cargo model a challenge – but possible Connected with the other models (Cargo/Pilotage/other RRM) Input for the accident model Methodology Summary and conclusion
Thank youbeaware.bonnagreement.org Questions?