Download
1 / 30
300 likes | 353 Views
Understand important enrollment trends, track concurrent enrollments, fulfill federal reporting requirements, and improve student targeting through data. Enhance decision-making with StudentTracker.

E N D
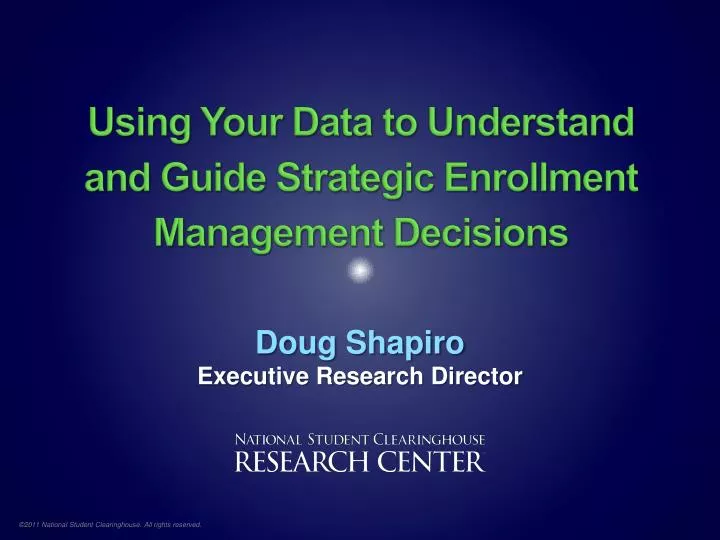
Using Your Data to Understand and Guide Strategic Enrollment Management Decisions Doug ShapiroExecutive Research Director
Perplexing Questions • Did my lost admissions enroll somewhere else? • Which ones went where? • Where did our transfer-out students attend and what degrees have they earned? • Did our graduates continue on to a 4-year college or to graduate school? • Which of our students are concurrently enrolled elsewhere?
StudentTracker A cost effective way to replace survey and anecdotal information with documented enrollment and degree data
StudentTracker Query Types Institutional Research • Identify important enrollment trends and patterns • Track concurrent enrollment of your students • Determine cohort graduation rates • Fulfill federal reporting requirements • Verify and correct cohort default rates
StudentTracker Query Types Admissions & Enrollment Management • Learn who is competing with you for which students • Improve your ability to target, select and retain students • Verify prior enrollments for transfer applicants • Target non-returning students for effective follow-up
StudentTracker Query Types Financial Aid • Track graduated/transferred Perkins borrowers • Verify parent/sibling enrollments • Verify/Challenge ED cohort default data • Support mid year transfer monitoring process • Determine who holds students’ loans (web)
Unit Maryland State Data Only Aggregate Clearinghouse Data Only Increase Matching RateState System to a National System Prince George’s Community College Measured transfer-out rate for a cohort of first-time freshmen, comparing results using Maryland’s state data sharing arrangement and the Clearinghouse 10.8% Transfer-Out Rate 30.8% 0% 10% 20% 30% 40%
Concurrent Enrollments There were 960 students concurrently enrolled at BYU and another institution during fall or winter semesters of 2001-02 96 different schools were represented
Voluntary System of Accountability (VSA) • Reporting system designed by APLU and AASCU for institutions to report standard outcomes in an accessible way. • The Clearinghouse provides enrollment and completion data via StudentTracker that populates the Undergraduate Success & Progress Rate Chart. • Posted on www.collegeportraits.org
VSA- Chart for Undergraduate Success and Progress Rate at University of Wisconsin-La Crosse • 92% of First-Time Full-Time Students had either completed a 4-yr degree or were still enrolled at a 4-yr institution 6 Years Later. • 67% completed locally at UW-Lax (green) • 17% Completed at a different 4-yr or 2-yr institution (lavender) • 2% were still enrolled at UW-Lax (Yellow) • 6% were still enrolled elsewhere (blue)
Providing Unit Data For those who transfer out: • Are majors equally represented? • Are GPA’s evenly distributed? • Is there unequal gender representation? • Do socio-economic factors tell us anything? • What about ethnic groups?
How StudentTracker Works 1. Submit cohort 3. Matches compiled in a StudentTracker report 2. Run file against our database *Instant queries for individual students can be performed via the Web 4. Email you when your report is ready
StudentTracker • Cohort Request File Requirements • Name • Date of Birth • Your School Code 95% or greater match rate if these elements are accurate
Response Files The Clearinghouse returns . . . • Control Report • Overview of Results • Summary Report • Contains totals of students enrolled by institution • Unit Record File • Contains individual student records (except FERPA blocked records)
Sample Control Report NATIONAL STUDENT CLEARINGHOUSE STUDENTTRACKER CONTROL REPORT #17907 FOR HOMETOWN UNIVERSITY (001234-00) YOUR FILE CREATION DATE: 5/23/2012 RANGE OF SEARCH DATES PROVIDED IN REQUEST FILE: 07/03/2006 - 01/16/2012 TOTAL STUDENTS IN YOUR REQUEST FILE: 111 TOTAL STUDENTS WITH NO RESPONSE DATA AVAILABLE: 13 TOTAL STUDENTS FOUND AND INCLUDED IN AGGREGATE REPORT: 98 LESS: STUDENT LEVELREPORTING BLOCKED BY SCHOOL: 0 LESS: STUDENT LEVEL REPORTING BLOCKED BY STUDENT: 4 TOTAL STUDENTS REPORTED AT DETAIL LEVEL: 94
Sample Unit Record File • Student identifier • Institution name and OPE code • Institution type (4 yr+, 2 yr, <2 yrs) • Public/Private • Term dates • Enrollment Status (Full, Half, Less than Half Time) • Multiple school sequence number • Graduation indicator (Y/N)
Sample Unit Record File (cont) • Class Level (Fr, So, Jr, Sr, Grad) • Enrolled major (up to 2) • CIP Code for major (up to 2) • Graduation date • Degree title • Major course of study (up to 4) • Degree CIP code (up to 4) For A2 DataSchools Only For DegreeVerifySchools Only
StudentTracker In Use % of Colleges with Active StudentTracker Accounts (Enrollment-weighted) As of 5/12/2010
StudentTracker Fees There are three options: • Pay an annual fee equal to school's enrollment times 10¢ ($300 minimum ) • Reduce fee by 50% (5¢ times enrollment or $150 minimum) by: • Participating in DegreeVerify & EnrollmentVerify, OR • Reporting additional data elements (A2) • Get StudentTracker for FREE by: • Participating in DegreeVerify & EnrollmentVerify, AND • Reporting additional data elements (A2)
StudentTracker Benefits • Provides unit-level and summary data for local and national research studies • Extremely flexible and easy-to-use • 100 million student records archived • Degree and enrollment data available • Fully FERPA compliant
Leveraging StudentTracker Research Services for Strategic Enrollment Management
Setting the Context: Bowen's Laws of Higher Education Finance & EM • Students as revenue • Selectivity as prestige • Diversity as excellence • Campus-based aid (non-endowed) as expenditures • MANAGE THE NEXUS • Colleges and universities raise all the money they can and spend all the money they raise in search for power, influence and prestige.
The Dual Responsibilities for Senior Enrollment Officers • Externally focused activities to shape the class • Internally focused, the interpretive strategy to shape expectations of senior policy makers
External: Tangible, Visible, & Can Be Benchmarked • Number of students • Pathways of students • Performance & Outcomes • Budgeting Strategy • Characteristics of students • Institutional image
Internal: The Interpretive • Characteristics of students • Institutional image • Position with Key Stakeholders • Shape realistic enrollment & revenue projections • Academic Planning • Accountability expectations
Data Drives EM Meta level – we have to understand… • Who are our students? • Where they have come from? • Why do the come to us? • How they progress through our institution? • What their experiences are like? • Do they graduate? • With new HEA, what happens to them after they graduate? • And now cohort default rates too
Enrollment Related Issues Institutions Are Encountering • Increasing admissions melt rate for publics • Containing discount rate • Tracking effects of new cohort default rate • Concurrent & dual credit enrollments • Impacts of changing demographics of traditional age students • Great recession • Accountability around transfer and degree completion • Growing competition
If You Don’t Know What’s Happening, You Can’t Do Anything About It Business Intelligence Gathering from StudentTracker