Download
1 / 11
110 likes | 356 Views
Using Visuals. Speaking and Writing for Engineers- Honors. Types of visuals. Tables Graphs Charts Photographs Drawings Diagrams. Referencing visuals in your document. Refer to tables as tables (Table 1)

E N D
Using Visuals Speaking and Writing for Engineers- Honors
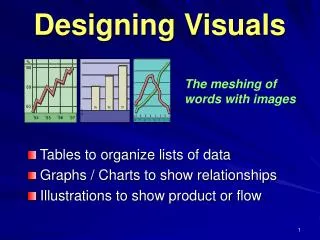
Types of visuals • Tables • Graphs • Charts • Photographs • Drawings • Diagrams
Referencing visuals in your document • Refer to tables as tables (Table 1) • Refer to all other visuals as figures (Figure 1) *do not use the words chart, photograph, etc.
Tables • Consist of columns and rows of numbers or words • Useful for presenting large amounts of data • Effective for showing the reader all the detail regarding the data
Graphs • Consist of lines that move up and down the page indicating changes in data across time • Useful in illustrating general trends
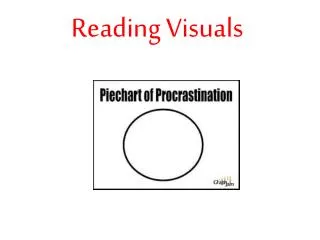
Charts (bar and pie) • Useful in comparing one data set to another • Useful in comparing one data set to the whole • Provides general information about the data
Photographs • Excellent for showing scale • Best choice when it’s necessary to show all details
Drawings • Simplified illustrations • Can strip away extraneous detail and focus only on the key objects, parts, or actions
Diagrams • Abstract illustrations of objects or processes • Focus on infrastructure or concepts
Rules for using Visuals • Give each table and figure a descriptive title. • Put table titles above the table. Put figure titles below the figure. • Number tables and figures sequentially in the order they appear in your document, beginning with Table 1 and Figure 1. • Place visuals just after the first point of reference in the document.
Rules for using Visuals, cont. • Cross reference each visual in the text of your document. (Figure 1 shows. . .) • Balance visuals with text for a professional appearance. • Use labels and legends as needed. • Credit sources for any borrowed information included in a visual.