Download
1 / 50
500 likes | 615 Views
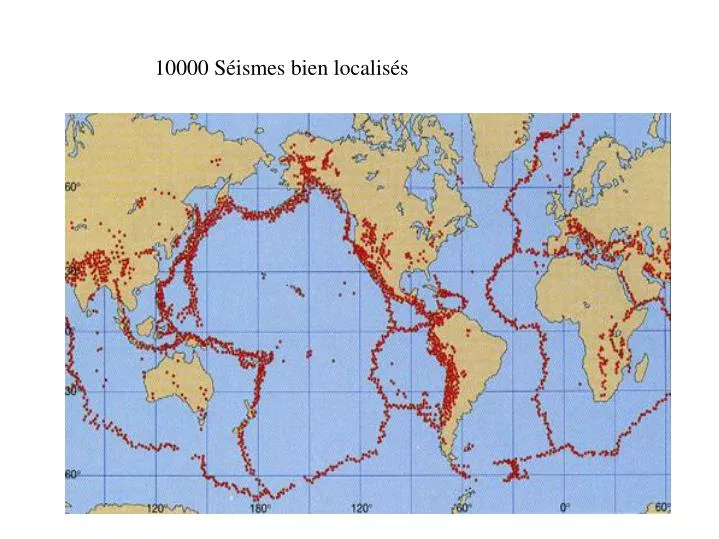
10000 Séismes bien localisés. Triangulation. With three or more stations, you can locate the earthquake using triangulation. Méthode naïve de détermination de distances. epicentre. Bonne approximation au km près Fortes erreurs onde S. observateur. D. Tp-Ts. D. hypocentre.

E N D
Triangulation • With three or more stations, you can locate the earthquake using triangulation.
Méthode naïve de détermination de distances epicentre Bonne approximation au km près Fortes erreurs onde S observateur D Tp-Ts D hypocentre Pour un milieu standard Diagramme de Wadati Ts-Tp pente Tp To
Propriétés de la Fonction Coût Compensation Profondeur-temps PDF Probability density function Hypoellipse: programme utilisant l’aproximation linéarisée (ellipsoïdes)
Localisation d'un séisme aux Alpes Maritimes Anthony Lomax
Comparaison entre méthode linéaire et non-linéaire Anthony Lomax
La méthode de double différences On utilise la différence des temps d’arrivée entre stations: On localise sans inverser le temps d’origine que l’on détermine dans une deuxième étape On minimise: sur x0 Ce problème est très bien posé car il n’y a plus de compensation entre t0 et z0
Détermination de résidus relatifs par intercorrelation Deux stations 0.2 s
Détermination de résidus relatifs par intercorrelation Intercorrelation Domaine spectral Real C(w) Imag C(w)
Evolution spatio-temporelle de la crise de 2001 (thèse de Francesco Pacchiani, 2006)
Relocalisation (~50% des évenements) Après relocalisation Avant relocalisation
Le premier modèle latéralement hétérogène M84C Proposé par Dziewonski et Woodhouse (1985) Ce modèle contient des harmoniques d'ordre < 8 Perturbation des S Perturbation des P 4% -4% D’après Dziewonski et al, 2000
Global models of P and S waves Laterally heterogeneous Spherically symmetric D'après Chaljub et Vilotte, 1999
Vérifications des inversions tomographiques Test du damier Section sous Victoria, Au C’est pas génial! Grabert et al 2002
Tester la qualité de la tomographie est difficile Example Tomographie avec des OBS face à Valparaíso (Chili) Zelt et al, GRL, 1999
Tester la qualité de la tomographie est difficile Zelt et al, GRL, 1999 Nombre des rais Test du damier
Tomographie 2000 10000 Séismes bien localisés Catalogue complet pour M>5.5 depuis 1964 Engdahl et al 1998-2002
L'image que nous a convaincu Section le long de 30°N P waves Grand, van der Hilst, Widiyantoro 1997 S waves
Le manteau d'après Grand et al, 1997
Est-ce une plume, est-ce un swell (gonflement) ? Ritsema et al, Science 1999
Ce qu'un peu de couleur peu faire ... Echelle non saturée Echelle saturée
Des amélioration récentes de Montelli et al Science 2004
Une vue très moderne de l'Asie et du Tibet Replumaz et al
Plate motion during the last 50 Myears Replumaz et al
La grande zone de subduction il y a 40 Ma Replumaz et al
Local earthquake tomography Husen et al JGR 1999
The available data Husen et al JGR 1999
A simple interpretation of the images Serpentinisation Husen et al JGR 1999