Download
1 / 46
470 likes | 622 Views
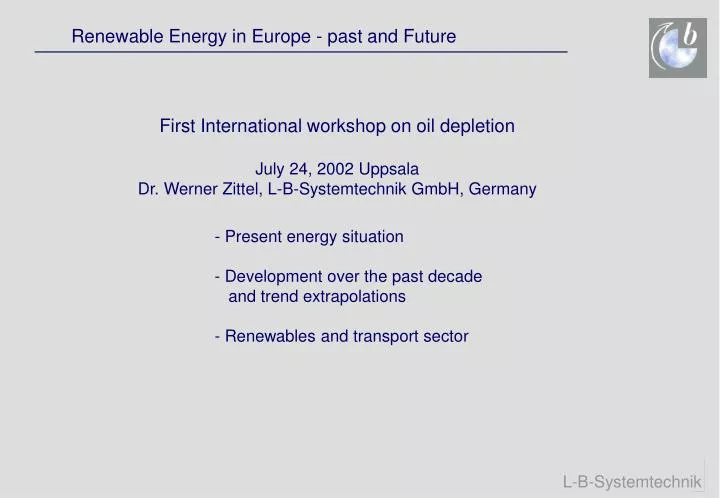
Renewable Energy in Europe - past and Future. First International workshop on oil depletion July 24, 2002 Uppsala Dr. Werner Zittel, L-B-Systemtechnik GmbH, Germany. - Present energy situation - Development over the past decade and trend extrapolations - Renewables and transport sector.

E N D
Renewable Energy in Europe - past and Future First International workshop on oil depletion July 24, 2002 Uppsala Dr. Werner Zittel, L-B-Systemtechnik GmbH, Germany - Present energy situation - Development over the past decade and trend extrapolations - Renewables and transport sector
Renewable Energy in Europe - past and Future • Most official energy forecasts extrapolate „business as usual scenarios“ • If no structural problem in conventional energy supply is perceived, there is no need • to change to renewable fuels • Under present economic conditions renewable energy sources are uneconomic or marginally economic (neglecting external costs and subsidies of fossil and nuclear fuels) • However, if climate change is a real issue, if nuclear has serious problems and if • oil becomes a scarce commodity, economic conditions will change in favor of renewable energy technologies
90 Mbpd 75 Mbpd Renewables and the Energy Sector Fuel: 2020-share TPES 13500 oil 39 % gas 26 % coal 25 % nuclear 5 % solar 5 % 80 Mbpd Source: IEA World Energy Outlook 2000
Renewables and the Energy Sector - a different view • If oil production will peak soon, this will have serious consequences on • economy and energy prices • In contrast to 1980, energy efficiency as well as renewable energy is at • a much more sophisticated technological and economic level • which allows for market introduction on a broad scale • The future will show which perspective is closer to reality. • It is not unlikely that future energy supply develops like the following:
90 Mbpd 75 Mbpd Renewables and the Energy Sector - a differentl view! 2020: IEA LBST TPES 13500 12500 oil 39 % 25 % gas 26 % 33 % coal 25 % 14 % nuclear 5 % 5% solar 5 % 23 % 80 Mbpd : BP Statistical Review of World Energy : LBST most likely forecast
How much oil is left for Europe • If oil production peaks soon, the oil consumption • pattern has to balance the supply • If any region in the world requests more oil this is on the expense • of any other region • Concerning the lessons from the 1980ies, Europe has learned to • keep its oil consumption almost constant • Concerning the last decade, renewable energy has started its market • introduction in Europe. Average growth rates were far above • 10 percent p.y. for most renewables
How much oil is left for Europe? Mto +0.5 % Average growth 1975-2000: 1 % p.y. - 2 % +0.8 % ROW +1.6 % World oil consumption +0.4 % +0.8 % North America EU-15
EU-15 End use energy requirement and oil dependence • The industry learned from the 1970ies oil crises • to reduce its energy consumption • Only the transport sector grew steadily over the last 40 years • The share of electricity on final energy supply is rising • The transport sector is most vulnerable to oil supply disruptions • The whole industry depends on cheap transport („just in time“ is • cheaper than large store houses)
EU-15 End use energy requirement and oil dependence Mtoe Source: OECD renewable other electricity oil other Industry transport electricity Industry Other Transport
EU-15 Electricity Production from Wind energy • In the 1980ies, Denmark started to establish a wind energy industry • Today the Danish wind energy industry has more employees than the • ship building industry • In the 1990ies, Germany supported the wind energy industry by feed-in ruels [Renewable Energy Act] which gave marginal earnings (at favorable sites and with good planning the return on investment is reasonable, at poor sites or with poor management the return on investment is negative) • Most European Countries have not yet even started to use its wind energy potentials • Even under „poor“ economic conditions wind energy has growth rates at about • 40 percent p.y. since more than a decade. Even today the share of wind energy in electricity generation is above 1 %. • As soon as even pure market economics are in favor of wind energy, the growth • rates could enhance and swap over to those countries with vast resources
EU-15 Electricity Production from Wind energy GWhel EU-Electricity Production 2000: ~ 2500 TWh Growth Rate 1990-2000: ~ 40 % p.a.
EU-15:Power Plant Capacity - Wind energy vs Nuclear • In 2001 Europe added wind capacity which was four times as much as that of an average nuclear plant. • The electricity generated in 2002 will be more than that of four nuclear power plants • The growth of wind energy is as fast as the growth of nuclear power 30 years ago • Planning times of new wind parks are in the range of 2 - 3 years before grid connection is achieved
EU-15:Power Plant Capacity - Wind energy vs Nuclear Installed Capacity MW/a Annual Growth MW Installed nuclear capacity in Europe Spain Sweden Additon of new wind capacity France UK Installed wind capacity Germany Source: World Watch Institute, 1999 March 1999
EU 15 - Electricity Production from Wind Energy - Forecast • The European Wind Energy Association expects wind energy to contribute • about 5 % of EU-15 electricity supply until 2010 and above 10 percent until 2020. This is euqivalent to 20 % annual growth • The actual growth rate is even higher
EU 15 - Electricity Production from Wind Energy - Forecast MW 40 % p.a. EWEA- Forecast 2000 Share on EU-Electricity Production 5 % Onshore offshore Growth Rate 1990-2000: ~ 40 % p.a. 20 % p.a.
EU-15 Electricity Production from Biomass • Sweden, Finland and Austria have the largest share of biomass in • electricity production • The growth rate in Finland was about 10 % annually • The share of biomass in electricity generation is about 0.8 percent
EU-15 Electricity Production from Biomass GWhel EU-Electricity Production 2000: ~ 2500 TWh Growth Rate 1991-1998: ~ 7 % p.a. Sweden Finland (10 % p.a.) Austria Source: OECD Statistics 2000
Share on EU-Electricity Production 5 % EU-15 Electricity Production from Biomass - Forecast GWhel EU-Electricity Production 2000: ~ 2500 TWh 20 % p.a. 10 % p.a. 7 % p.a. Growth Rate 1991-1998: ~ 7 % p.a.
EU-15 Electricity Production from Photovoltaics • The growth of PV was largest in Germany over the last decade (~ 30 %) Since the existence of the feed-in law in 1999 the growth rate increased strongly • Today, installed PV capacity in Germany is at the same level as wind energy was • ten years ago • The costs of grid connected PV systems have reduced by a factor of three over the • last 15 years and today are close to 0.6 EUR/kWh • Presetnly, BP alone employs more than 1000 employees in the PV business
EU-15 Electricity Production from Photovoltaics GWhel EU-Electricity Production 2000: ~ 2500 TWh PV-Share on Electricity Production in 2001: ~ 0,009 % Growth Rate 1991-2000: ~ 20-30 % p.a. Germany
EU-15 Electricity Production from Photovoltaics - Forecast • BP expects to reduce costs by another factor of two within next five years • Shell expects annual cost reductions by 5 - 6 percent • Swiss bank Sarassin expects the growth rate of PV to increase substantially over • the next few years (comparable to the cellular phone or PC market in the last years) • If the growth rate over the next ten years is the same as the growth rate of wind • energy over the past ten years, PV will contribute more than 1 percent to • EU electricity in 2010
Share on EU-Electricity Production 1 % EU-15 Electricity Production from Photovoltaics - Forecast GWhel 50 % p.a. 40 % p.a. EU-Electricity Production 2000: ~ 2500 TWh Share on EU-Electricity Production 5 % Growth Rate 1991-2000: ~ 20-30 % p.a. 20 % p.a.
EU-15 Electricity Production from Geothermal Energy • Electricity production from geothermal grew about 3 percent annually • Today only Portugal, France and Italy use geothermal electricity • New methods (e.g. hot-dry rock; ORC electricity generation) open a huge • potential for electricity generation • The Geothermal Society expects electricity generation from geothermal • sources at 16 TWh in 2010 and between 24 - 64 TWh in 2020 (Ferrara- • Declaration 1999)
EU-15 Electricity Production from Geothermal Energy GWhel 5 % p.a. EU-Electricity Production 2000: ~ 2500 TWh 3 % p.a. Geothermal-Share on Electricity Production 2000: ~ 0,17 % Growth Rate 1991-2000: ~ 3 % p.a. Portugal Growth Rate 1991-1998: ~ 30 % p.a. Italy
EU-15 Electricity Production from All Renewables • Today Renewable Electricity supply has a share of 14 - 15 percent • If present trends continue for the next 20 years, this share will increase • to more than 20 percent in 2010 and to more than 50 percent in 2020 • (provided total electricity supply will remain constant; note that this holds even when hydro is kept constant and when wind energy will rise at half of • its historical growth rate) • If trends of „best practice countries“ apply to all EU countries this share could rise even faster
EU-15 Electricity Production from All Renewables TWhel Biomass 7 % p.a. Trend extrapolation Wind 20 % p.a. TWhel Solar 20 %p.a. Geothermal 3 %p.a. Hydro 0 % p.a. EU-Electricity Production 2000: ~ 2500 TWh Biomass 10 % p.a. Wind 20 % p.a. Trend extrapolation from „best practice“ countries Solar 40 %p.a. Geothermal 30 %p.a. Hydro 0 % p.a.
EU-15 Thermal End Use Energy Supply by Biomass • Contribution of biomass to thermal energy supply is about 6 %. • The annual growth rate varies between 2 - 5 percent annually • At present growth rate this could increase to 10-20 percent in 2020
EU-15 Thermal End Use Energy Supply by Biomass GWhth 10 % p.a. Growth Rate Thermal End Use Energy Demand: ~ 6000 TWh 5 % p.a. Growth Rate Share on EU Themal Energy Demand 10 % 2 % p.a. Growth Rate Growth Rate 1991-1998: ~ 2 % p.a. Sweden 4-5 % p.a.
EU-15 Thermal End Use Energy Supply by Solar Energy • Average growth rate of Solar thermal energy use is about 10 % annually • In Greece Solar thermal energy has a much higher share • than in Italy, Portugal or Spain with comparable • solar isolation. This is mainly due to different political support • The contribution in 2020 could rise to between 0.5 - 3 % if present trends continue (lower figure 10 % annual growth rate, upper figure 20 % annually)
EU-15 Thermal End Use Energy Supply by Solar Energy GWhth Thermal End Use Energy Demand EU 2000: ~ 6000 TWh Solar Share on Thermal End Use Energy Supply 2001: ~ 0,08 % Greece Growth Rate 1991-2000: ~ 10 % p.a. Growth Rate in Germany 1991-2000: ~ 20 % p.a. Growth Rate in Austria 1991-2000: 15 % p.a. 2001-Zahlen: LBST-Schätzung mit BRD-Zahlen aus SW&T1/02
The Potential of Renewable Energy in the European Community • At the present growth rate, renewable energy will rise to a share of about 10 percent of thermal energy use in 2020 • At growth rates applicable to „best practice“ countries the share could rise to about 20 - 25 % • On the other hand: Thermal energy is mainly used in buildings • where in general the highest potential for increased efficiency exists
The Potential of Renewable Energy in the European Community EU-thermal energy demand 2000: ~ 6000 TWh Biomass 2 % p.a. TWh th Solar 10 %p.a. Geothermal 3 %p.a. Biomasse 5% p.a. Solar 20 %p.a. Geothermie 10 % p.a.
Technical Potentials of Renewable Energy Sources in the EU • The potential for biomass includes only biogenic waste, residues and sludge • The wind power potential minimum includes offshore sites up to 10 km distance from cost line and 10 m water depth • The wind power potential maximum includes offshore sites up to 30 km • distance from cost line and 30 m water depth • The PV potential minimum includes only roof mounted solar cells • The PV potential maximum includes facade mounted modules • The Solar Thermal potential includes only sites south of 40 °
Technical Potentials of Renewable Energy Sources in the EU (Biomass: Thermal Energy; Hydro Power, Wind, PV und SOT: Electric Energy) EU Electricity Consumption 1998: 2.468 TWh (Source: IEA 2000) TWh/a Upper Value Wind offshore Technological Progress Lower Value Roof mounted + house fronts with todays technology Straw Residue Agriculture Wood Residues, other Roof mounted Forest Residue Industrial Wood Res. Bio Waste Wind onshore * ** Biogas (Methane) Biomass Wind Power PV conventional Tidal Power * still to tap potential in the EU ** only EU Sludge
EU- oil consumption in Transport and scenario for future reductions • Assumption: • Each year ten percent of cars are replaced • The average fuel consumption of new cars reduces by x percent with respect to the preceeding year • In Germany the average fuel consumption of all passenger cars • grew from 8.1 l/100km in 1960 to ~10 l/100km in 1975; it was • almost constant until 1985 and reduced to 9.4 l/100 km in 1990 • and to ~8.5 l/100 km in 2000. However most of this was offset by • higher traveling volumes. * still to tap potential in the EU ** only EU Sludge
EU- oil consumption in Transport and scenario for future reductions Mto Fuel consumption of new cars in 2020 with respect to 2000 fuel consumption X=0.5 % 90 % Oil consumption of Traffic X=1 % 82 % X=2 % X=5 % 67 % Assumptions - Average life time of cars 10 years - each year fossil fuel consumption of all new cars decreases by x % 37 %
Future fuels for cars Future Challanges: - reduction of demand - change of mode (modal split) - downsizing of cars - hybrid vehicles - switch to renewable fuel Renewable Fuel: - hydrogen - electricity - Biofuels
Technical Potentials: Fuels derived from Biomass in the EU - range TWh/a Potentials show possible alternatives and cannot be added. Available area for cultivation of energy plants in the EU: 3,3 - 26,4 Mio ha Rail Transport Inland Navigation Aviation Road Transport Cultivation (fast growing plants) Wood and Straw Residues Via Biogas (Transport) 1998 * Biogas (Methane) Methanol Synfuel Plant Oil Ethanol from Lignocellulose Hydrogen (pressurized) *Source: IEA-Statistics 1997-1998
Technical Potentials: Fuels Derived from Biomass in the EU • Comments on the available area for cultivation for the growing of energy plants: • The upper value (26.4 Mio ha) assumes an increased intensification of agricultural production (FfE 1998). • A further intensification of agricultural production is not sustainable. Therefore the EU aims at extensification. • Oil plants: The share of rape seed may not exceeed 25% within the rotation cycle of a given crop. With biological agriculture method this limit is lower. • An assignment of 26.4 Mio ha to the growing of energy plants would represent 30% of the arable land in the EU • The area not cultivated (laid off) at present has a size of about 7.2 Mio ha (FfE 1998).
Technical Potentials: Fuels Derived from Biomass in the EU - probable TWh/a Potentials show possible alternatives and cannot be added. Cultivable area for energy plants in the EU: 7.2 Mio ha Rail transport Inland navigation Aviation Road transport Cultivation (fast growing plants) Wood and straw residues Via Biogas (Transport) 1998 * Biogas (Methane) Methanol Synfuel Plant Oil Ethanol from Lignocellulose Hydrogen (pressurized) *Source: IEA-Statistics 1997-1998
Technical Potentials: Fuels Derived from Renewable Electricity (EU) Warning: The folowing technical potential does not take care of alternative use of the renewable source.
Technical Potentials: Fuels Derived from Renewable Electricity (EU) Rail transport Inland navigation Solar thermal power stations 3) Aviation Road transport PV (roofs) Wind off-shore Wind on-shore Consumption (Transport) 1998 1) CGH2 Methanol LH2 Hydro power2) 1) Source: IEA-Statistics 1997-1998 2) still to tap potential 3) within the EU
Hydrogen / Methanol: Green-House-Gas Emissions (CO2-Equivalents)
Fuel Costs and GHG Emissions of Compressed Gaseous Hydrogen (EU) gasoline / diesel 300 without With tax [g/kWh] 200 equivalent - 2 CO 100 CGH from ... 2 Windpower Biomass Solarthermal offshore Hydro 0 0.5 1.0 1.5 2.0 Source: LBST, 2001 0 1 2 3 4 Costs [EUR/ l ] gasoline equivalent
Summary • The growth of renewables in Europe was different in all countries due to • different political support • Simple trend extrapolation exhibits that at present growth rates • more than 20 percent of electricity will be renewable in 2010. • This share would rise to about 50 percent in 2020 • Even in countries supporting renewables they are still close to • „being marginally economic“. As soon as market economics change (e.g. by passing oil peak production) the growth rates could enhance • The potential is sufficient to ensure a 100 percent renewable energy supply • The transport sector will be hit strongest by oil scarcity. Introduction of • new fuels is most difficult here • The future will show which growth rates will be realised and which energy • mix will be achieved • Detailled strategies exist how to substitute fossil and nuclear fuels completely • by 2050 [e.g. EU financed LTI-Study 1998]