Download
1 / 23
230 likes | 316 Views
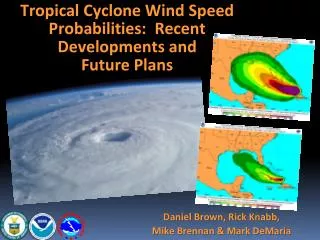
Estimating tropical cyclone wind radii using an empirical inland wind decay model. John Kaplan NOAA/Hurricane Research Division Miami, FL Jason Dunion and Nicholas Carrasco CIMAS/Hurricane Research Division Mark DeMaria NOAA/NESDIS Fort Collins, Colorado.

E N D
Estimating tropical cyclone wind radii using an empirical inland wind decay model John Kaplan NOAA/Hurricane Research Division Miami, FL Jason Dunion and Nicholas Carrasco CIMAS/Hurricane Research Division Mark DeMaria NOAA/NESDIS Fort Collins, Colorado Interdepartmental Hurricane Conference March 22, 2006 Acknowledgements: Joint Hurricane Testbed
Background • An empirical decay model (Kaplan and DeMaria 1995, 2001) has been developed to predict the decrease in wind speed of landfalling tropical cyclones. The model assumes that a cyclone’s winds decrease exponentially with time after landfall to a non-zero background wind speed using: where Vt = the maximum wind at some time t h after landfall, V0 is the landfall wind speed, Vb is the background wind speed and is the decay constant. • The decay model can be used to: Predict the decrease in maximum wind speed near the storm center (DeMaria et al. 2005) Estimate the maximum wind speed at inland locations for various landfall forward speeds and maximum intensities (FEMA, 1995). Provide a 2-dimensional swath of post-landfall wind speed (Dunion et al. 2003)
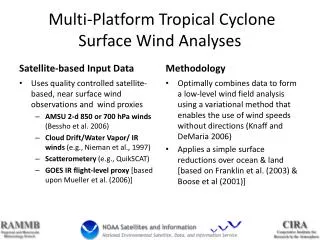
Methodology • Swaths of the maximum sustained wind were generated for major U.S. landfalling hurricanes Charley(2004), Dennis(2005), Katrina (2005), Rita (2005), and Wilma (2005) • A parametric wind model (Kaplan and DeMaria 1995, Knaff and DeMaria 2006) and the the wind radii from the official NHC forecast were used to generate the initial storm vortex • The decay model was run separately using storm track and landfall intensity information from the official NHC advisory (“Official swaths”) and best track files (“Best track swaths”), respectively • Maximum wind swaths were evaluated at all over-land and near shore in-situ wind observation locations from the time of landfall until the system became extra-tropical • All in-situ wind observations were converted to 1-min maximum winds at 10 m for open over-water or over-land exposure (Powell et al. 1996, Powell et. al 1998)
Absolute errors between the wind swaths and in-situ observations for each individual storm and for the 5 storm sample
Bias of the decay wind swaths for each storm individually and for the 5 storm sample average
Wind swaths for Charley (2004)for 12 UTC 13 August Best track swath Official swath
Absolute errors of the “best track” wind swaths with radius for the 5 storm sample
Bias of the “best track” wind swaths with radius for the 5 storm sample
Methodology for wind radii estimation • Estimates of the 64,50, and 34 kt wind radii were obtained at ~3h after landfall for each storm using Hwind (Powel et al. 1998) • Estimates of the 64 kt, 50kt and 34 kt wind radii were also computed at the time of each Hwind analysis using the decay model • Wind radii estimates were obtained using both “Official” and “Best track” input data
“Best track” decay model predicted (white) vs Hwind analyzed wind radii (red) (nautical miles) at 2300 UTC on 8/13/04 for Charley 64 50 34 NE 15 (13) 25 (20) 70 (33) SE 15 (15) 25 (23) 75 (45) SW 15 (13) 20 (20) 40 (36) NW 15 (0) 20 (0) 35 (17)
Data coverage for Hwind analysis at 2300 UTC 8/13/04 for Hurricane Charlie
“Best track” decay model predicted (white) vs Hwind analyzed (red) wind radii (in nautical miles) at 1740 UTC on 8/29/05 for Katrina 64 50 34 NE 35 (56) 75 (97) 290 (164) SE 45 (49) 110 (136) 415 (239) SW 25 (0) 75 (65) 250 (185) NW 25 (33) 50 (55) 155 (120)
“Best track” decay model (white) vs Hwind analyzed (red) wind radii (in nautical miles) at 1245 UTC on 10/24/05 for Wilma 64 50 34 NE 55 (85) 100 (117) 305 (166) SE 60 (98) 120 (140) 400 (220) SW 45 (85) 105 (137) 330 (368) NW 0 (0) 65 (102) 140 (316)
Absolute errors of the decay model vs Hwind 64 kt, 50 kt and 34 kt wind radii for the 5 storm sample
Bias of the Decay model predicted 64,50, and 34 kt wind radii vs Hwind for the 5 storm sample
Summary Empirical decay model maximum wind estimates along the tracks of 5 major landfalling hurricanes were in fairly good agreement with available in-situ surface wind observations. Decay model estimates of the 64 kt and 50 kt wind radii were also in reasonably good agreement with Hwind 64 kt and 50 kt wind radii estimates. However, the decay model over-estimated the 34 kt wind radii. A new version of the decay model that better accounts for tropical cyclone decay over islands and peninsulas (DeMaria et al. 2006) will be tested for it ability to provide improved wind radii estimates. Real-time wind radii estimates will be made during the 2006 hurricane season.
“Best track” decay model predicted (white) vs Hwind analyzed wind radii (red) (in nautical miles) at 2230 UTC on 07/10/05 for Dennis 64 50 34 NE 25 (0) 30 (20) 90 (51) SE 25 (0) 30 (20) 100 (165) SW 20 (0) 20 (0) 60 (114) NW 25 (0) 25 (10) 65 (44)
“Best track” decay model predicted (white) vs Hwind analyzed (red) wind radii (in nautical miles) at 1045 UTC 10/24/05 for Rita 50 34 NE 35 (0) 65 (43)290 (88) SE 35 (25) 80 (91) 290 (250) SW 25 (17) 60 (26) 160 (176) NW 30 (21) 55 (32) 170 (165)
Data coverage for Hwind analysis at 2230 UTC on7/10/05 for Dennis
Data coverage for Hwind analysis at 1740 UTC on 8/29/05 for Katrina
Data coverage for 1045 UTC Hwind analysis on 9/24/05 for Rita
Data coverage for the Hwind 1245 UTC 24 October analysis for Hurricane Wilma (2005)