Download
1 / 24
250 likes | 372 Views
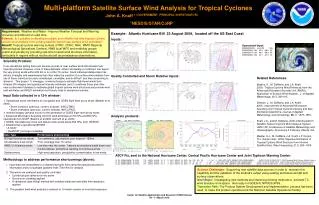
Development of a Multi-platform Satellite Tropical Cyclone Wind Analysis System. By John Knaff, Kimberly Mueller, Mark DeMaria and Ray Zehr. A demonstration project funded by NOAA Grant NA67RJ0152. Advisory/Forecast Requirements. Location Current latitude and longitude + motion

E N D
Development of a Multi-platform Satellite Tropical Cyclone Wind Analysis System By John Knaff, Kimberly Mueller, Mark DeMaria and Ray Zehr A demonstration project funded by NOAA Grant NA67RJ0152
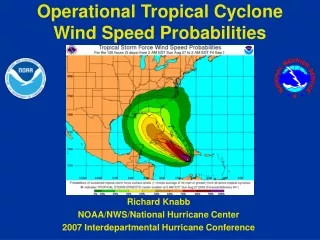
Advisory/Forecast Requirements • Location • Current latitude and longitude + motion • Forecast through 5 days • Intensity • Current intensity to nearest 5 kt • Forecast through 5 days • Structure • Current R34,R50, R64 in quadrants • Forecasts through 3 days.
What is available to determine TC structure (e.g., Most of the Time) • Surface observations • Satellite • IR/WV/Vis cloud drift winds • High quality, but far from the center • Spatial coverage often limited • Quikscat – surface wind vectors • Speeds good to 50 kt • Rainfall effects winds • Directions unreliable • SSM/I surface wind speeds • Rain free areas • Speed only • AMSU nonlinear balance winds • Temporal coverage limited • Not at the surface • Not available to the forecasters
What is Needed to determine TC Structure (sometimes in the Atlantic/E. Pacific) Aircraft + Surface observations + Satellite observations = A complete 2-d wind field + Boundary layer wind estimation model (e.g., H*winds, Franklin et al. observations, Kepert’s model etc…) = Surface Winds
How to get what is needed all of the time? Answer: Satellite only 2-d TC wind analysis (@ flight level) Needs • A way to estimate the winds of the TC core • An analysis method that can make efficient use of the existing satellite derived wind data
Needs 1: Estimate of Near Core TC Winds Develop relationships between Infrared (IR) satellite imagery and flight level winds (i.e., Kimberly Mueller’s Poster) • IR Satellite data • Global coverage of the tropics and subtropics • Half-hourly temporal coverage (most places) • Air Force Reconnaissance Data (1995-2003) • Measurements of winds, thermodynamics, location every 10s • Systematic flight pattern and flight level • 87 storms, 405 independent cases
Hurricane FLOYD – 1515 UTC 14 Sep 99 Hurricane IRIS – 0015 UTC 9 Oct 01
Modified Rankine Vortex • The modified Rankine vortex is described by • Where: • V = tangential wind speed • Vm = VMAX – C • C = storm translational speed • r = radial coordinate • Rm = radius of maximum wind • x is unit less, positive number derived empirically from existing infrared data Vm=100 kts, Rm=55 km, x=0.5
Inner Core Wind Analysis The Vortex Model requires: • From the Best track/advisory • Center Position • Motion Vector • VMAX • From IR analysis • RMAX – statistically derived • X – statistically derived from Rmax, Vmax and V at 182km
IR-Derived RMW V at 182 km
Asymmetric Wind Analysis • Storm motion is assumed to be the only contributor to TC asymmetry • Use the best track mean 12-h motion • Maximum wind is assumed to act 90 degrees to the right of motion, where
Needs 2: A Wind Analysis Method • Independent of the coordinate system • we use a cylindrical framework. • Input can be weighted for reliability and density • Can utilized scalar wind or “speed only” information • Accumulates data in a storm-relative framework using the working best track and advisory forecast positions
Variational Wind Analysis • Find Uij Vij to minimize cost function C (Thacker and Long 1990): C = wk[(uk-Uk)2 + (vk-Vk)2] + wm(sm-Sm)2 + [(rUij2 +rVij2) + (Uij2 + Vij2] • Uij Vij are gridded radial and tangential wind • u k,vk = obs, Uk Vk= analysis counterpart of ukvk • sm,Sm are observed wind speeds and analysis counterpart • Wk andWm are data weights • , terms are smoothness constraints • The wind analysis is gridded function that is interpolated to observation point • azimuthal smoothing >> radial smoothing • Could also add other constraints if necessary
Example: Hurricane Ivan 0912 18Z Datasets available • IR-based core (0-200 km) estimate at 1800 UTC • AMSU nonlinear balanced winds at 1214 UTC • SSMI F13, F14, F15 at 1253, 1330, 1423 UTC • Quikscat at 1045 UTC • Cloud drift, WV winds at 0745, 1115, 1345, 1655 UTC.
Datasets (continued) QSCAT AMSU ( Plot provided by Remote Sensing Systems available at www.remss.com )
Datasets… SSM/I (Plot provided by Remote Sensing Systems available at www.remss.com )
Cloud drift and water vapor winds From CIMSS
Final Analysis R34 175 180 125 185 R50 120 115 80 125 R64 80 65 60 60 From this analysis R34 150 120 100 150 R50 100 90 70 90 R64 80 60 45 55 18Z advisory
How Does this relate to H*Wind? • Complementary (not a replacement) • Could be a input to H*Wind • Differences • Fully automated (soon) including quality controls • Can be produced globally • Does not rely on recon • Can utilize “speed only” datasets • SSMI • Cylindrical coordinate framework
Future Plans In the next few months • totally automate analysis, data weighting and quality control. • Investigate options for creating surface wind estimates • Producing wind analyses every 6 hours by mid 2005 (data dependent) and display them via a web site. • Evaluate and take feedback as to its usefulness at the end of the 2005 Hurricane Season.