Download

1 / 10
100 likes | 367 Views
Dent Business Academy Business Strategies for the Winter Season. Harry S. Dent, Jr. Dent Research. Session 5: . Consumer Life Cycle and Micro Demographic Opportunities. Charts. Total Consumer Spending. 50-53. 46. Average Annual Expenditures. Age. Chart 5-1.

E N D
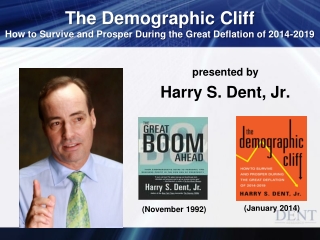
Dent Business Academy Business Strategies for the Winter Season Harry S. Dent, Jr. Dent Research
Session 5: Consumer Life Cycle and Micro Demographic Opportunities Charts
Total Consumer Spending 50-53 46 Average Annual Expenditures Age Chart 5-1 Data Source: U.S. Census Bureau
Micro Trends 1 Trade-up Home; Potato Chips/Groceries Mortgage Interest; Trade-Up Homes 42 41 Spending 33 31 Childcare/ Babysitting 28 First/Starter Home 26 25 Childbirth- Infant Furniture 20 Marriage First Car Workforce Entry 20 25 30 35 45 Age Chart 5-2 Data Source: U.S. Census Bureau
Micro Trends 2 Mid-Life Cycle 46 48 51 Autos Motorcycles; Vacation Homes Furniture; Tires 54 College Tuition Spending 53 Home Improvement 54 43 45 48 51 Age Chart 5-3 Data Source: U.S. Census Bureau
Micro Trends 3 Elderhood China/ Dinnerware 55 Life Insurance; Doctor’s Fees Hospitals; Travel 58 60 Vacation and Retirement Homes Spending Cruise Ships 65 Medicare Co-Pay 70 77 81 84 74 Prescription Drugs Garden/ Lawn Care Nursing Homes 55 60 65 70 75 80 85 Age Chart 5-4 Data Source: U.S. Census Bureau
U.S. Net Housing Demand 100=2005 Chart 5-5 Data Source: US Census Bureau, Dallas Federal Reserve, 2013
Consumer Real Estate Cycle 41-43 Trade-Up Homes 60 Resorts 65 Vacation & Retirement Homes Spending 31-32 Starter Homes 84 26-27 20-21 Apartment & Shopping Centers Nursing Homes Offices 85 45 20 25 30 35 40 50 55 60 65 70 75 80 90 Age Chart 5-6 Data Source: U.S. Census Bureau
Best Aging Markets in Order of Time • Discretionary healthcare, wellness and weight-loss • Overseas travel • Health, life insurance and financial planning • Recreational vehicles (RVs) • Cruise ships • Downtown condos/town homes and exurban retirement communities • Landscaping and home maintenance services • Convenience and drug stores • Pharmaceuticals and vitamins • Funeral homes and cremation services • Nursing homes and assisted living facilities Chart 5-7
Top 1% and 10% Income and Wealth Chart 5-8 Data Source: Alvaredo, Facundo, Anthony B. Atkinson, Thomas Piketty and Emmanuel Saez, The World Top Incomes Database, h ttp://g-mond.parisschoolofeconomics.eu/topincomes, 2013, Edward Wolff, as printed in Wealth and Democracy and New York University, 2010