Download
1 / 18
180 likes | 283 Views
Data Driven Safety. X-15 Simulator. X-15 Simulator Use. Time honored criteria to predict aircraft behavior failed to uncover serious threats Pilot controlled flight-simulation device developed to aid research Researchers could now simulate and analyze hazardous conditions at a lower risk

E N D
X-15 Simulator Use • Time honored criteria to predict aircraft behavior failed to uncover serious threats • Pilot controlled flight-simulation device developed to aid research • Researchers could now simulate and analyze hazardous conditions at a lower risk • Unknown hazards of controlling X-15 flight explored before flight • 10 hours simulation for 1 hour of flight • The application of X-15 simulation techniques to other aerospace applications was an unforeseen data-information-knowledge safety benefit of that program
Commercial Aviation Safety Analysis Of Data • Evolved from research programs in the 1950’s • Metal strip scribed with basic parameters • Heading / Time / Airspeed / Altitude • In 1958 the Civil Aeronautics Administration mandated use in commercial aircraft • By 1980’s second generation digital recorders were mandated which captured 11 parameters for up to 25 hours of recording time • Pitch / Roll / Vert & Long Accels / Thrust / Controls / Radio transmission
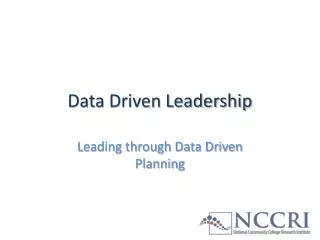
The 1960’s Marked the Beginning of Significant Improvements in Aviation Safety Hull loss accidentsper year* Reductions possible with continued Industry effort Departures, Millions* Hull loss accident rate* [Accidents per million departures] *Accident and Departure data through 31 December 2001 05/16/2002 FT-004Wc
Data Collection & Analysis • Digital Flight Data Recorders • DFDR (Black Box) • Modern equipment has several hundred recorded discrete parameters • Post accident investigations able to more accurately identify cause • Challenged to maintain hazard identification focus versus establishing blame • Aviation safety recorded remarkably improved
Flight Operations Quality Assurance • Systematic analysis of routine data • Thousands of hours of recorded data reduced to distribution graphs • Safety departments can focus on most critical information that exceeds some predetermined value
Routine Download and AnalysisData – Information - Knowledge • European community has employed this for over 30 years • U.S. just now implementing • Litigious society turns safety information into a liability • Non-punitive policy is imperative to success • Objective is to identify trends – not individuals • Cooperative efforts of 3 main parties necessary • Industry / Company • Regulators • Labor • Positive results already realized
Computer Technology Enhances Safety • Digital Flight Data Acquisition Units – DFDAU • Thousands of information sources can report to a central recording unit • Quick Access Recorders – QAR • Ease of access to data stream • Purpose of Program is to: • Detect latent patterns of behavior in human performance • Weaknesses in the aviation system supporting infrastructure • Anomalies in aircraft performance
New Focus on the Hazard • Thousands of hours of data reduced to distribution charts (Information) • Adverse systemic trends now addressed as root cause versus human failings (Knowledge) • Leading Indicators in trend data are point of focus versus accident investigation (Data Mining) • Safety departments can identify trends and lead decision makers to address highest threat (Proactive vs. Reactive)
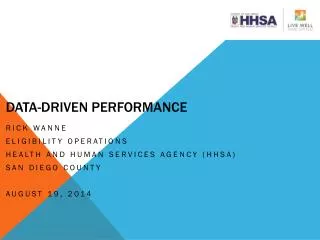
Worldwide and U. S. Airline FatalitiesClassified by Accident Type – 1992 through 2001 Total Worldwide Fatalities - 6,926 Worldwide U. S. Operators CFIT and Loss of Control Fatalities Worldwide = 4,523 or 65% 1382 CA Number of Fatalities 989 CC In- flight fire CFIT Landing Turbu- lence Un- known Loss of control in flight Mid- air collision Fuel tank explosion Takeoff config. Ice/ snow Wind- shear Fuel exhaus- tion RTO Runway Incursion Misc. fatality WW number of fatal accidents (112 total) U.S. Operators (22 total) 31 27 2 2 2 17 3 3 2 2 8 2 1 2 8 7 1 0 1 1 3 1 1 1 1 4 0 0 1 0 Note: • Accidents involving multiple, non-onboard fatalities are included. • Accidents involving single, non-onboard fatalities are excluded. • Western-built commercial transports > 60,000 lbs. • Hijack and Sabotage events are excluded CFIT = Controlled Flight Into Terrain RTO = Refused Takeoff Loss of Control: CA = Control Available; CC = Control Compromised 6/10/02 AT-002
Data Driven Safety Summary • Safety departments generally seen by accountants as not contributing to profitability • Safety as a Cost Center • Powerful new tools allow safety departments to statistically predict where the next high cost accident will happen • Limited resources are focused on the most significant hazards • Reductions in maintenance, operating, and training costs realized • Safety as a Profit Center