Download
1 / 22
220 likes | 329 Views
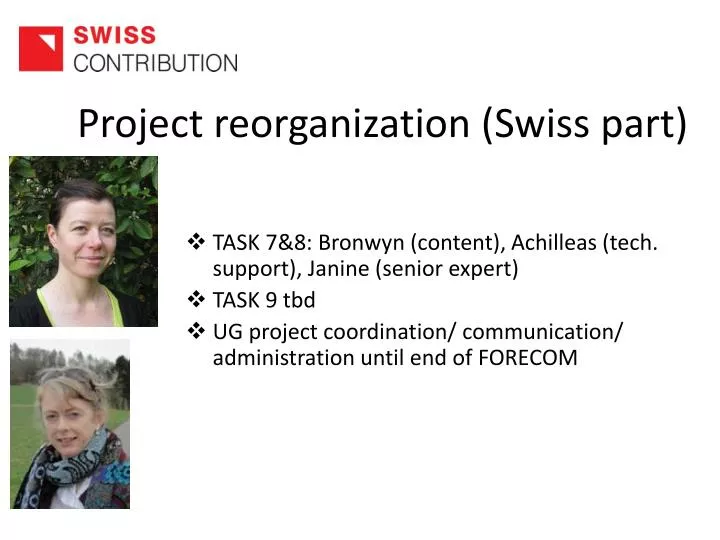
Project reorganization (Swiss part ). TASK 7&8: Bronwyn (content), Achilleas (tech. support), Janine (senior expert) TASK 9 tbd UG project coordination/ communication/ administration until end of FORECOM. Forest cover time series Swiss Alps first results.

E N D
Project reorganization (Swiss part) • TASK 7&8: Bronwyn (content), Achilleas (tech. support), Janine (senior expert) • TASK 9 tbd • UG project coordination/ communication/ administration until end of FORECOM
Forestcover time series Swiss Alpsfirstresults • Time series based on historical maps for -SA (1850/1880/1940/[1970]/current) • Trends and trajectories • Test reliability
Maps (the Swiss Alps) • Dufour Map Original Survey (~1850, scale 1:25 000 – 1:50 000) • Siegfried Map (edition 1880 and 1940, scale 1:25 000 – 1:50 000) • Landeskarte der Schweiz (1970sandcurrentstate, 1: 25 000)
persistent loss increase (ha)
Foresttransition GL NW OW URI GR portionof total landscape
Historicmapcomparison: Methodologicalchallenges • Test forconsistency: • Minimal Mapping Unit • Reliabilityoftrajectories • Comparisonwithindependentsources
TerrestrialPhoto Historical Map Orthophoto Vectorizationofforestcoverinformation Comparison -spatialoverlay -identificationoferrortypes Comparison -qualitative assessment -areas withgood/badagreement Hypothesis generation -topography -morphology Hypothesis test Application - Accurracymap large extent
TASK 6: Drivers ofpastforestcoverchangeconceptandfirstresultsforthe Swiss Alps TASK 6: Estimation of climate change and land use contribution to past forest cover change Research aims: • disentangling land use and climate effects for the past forest cover trajectories at different spatial and temporal scales • Compare drivers in Swiss Alps and Polish Carpathians
Potential drivers Scaleofanalysis climate/ topography context 1 ha raster (n=970’000) Target variable: Loss/gain (binary) • Administrative units • Communities (n=199) • Districts (n=15) • Cantons (n=5) Target variable: change in forest proportion (abs/rel) socioeconomics Test different combinationsofdrivers at different spatialresolutions
Socioeconomic Data • An extensive sample ofsocioeconomicdatahasbeencompiledfor all 199 communitieswithin FORECOM studyareaby Marc Herrmann (datatobejointlyused in AlpPast/FORDYNCH and FORECOM) • Parameters includeinformation on population (inc. Age distribution), accessibility (road/railway), agriculture, employmentsectors, commutersetc. • Not fullsetofparametersavailablefor all periods (mostgo back to 1930) • Transferabilityofapproachandcomparability -> identify minimal setofparametersavailablefor CH and PL
Socioeconomic Data Selectionbased on hypothesis AvailabilityPoland ?
Context Data Contextual variables include information that is determined by location. Some variables are clearly related to the biological system (distance to forest edge) others to socio-economy (distance to road/settlement)
Climate Data Basic dataset(1931-2010) Monthlytemperatureandprecipitationdownscaledto 100m resolution • Historical data (1850-1930) • Calculateanomaliestoreconstructedhistorical time series; monthlytemperature (Luterbacher), seasonalprecipitation (seasonal,Pauling). • Spatial Interpolation (100m grid) Final data(1850-2010) Meanvaluesfortemperatureandprecipitation (periods same asforfcc) MeanannualDDsum
Drivers context climate/topo 1 ha raster (n=969’700) Target variable: forestloss/forestgain Administrative units Target variable: change in forestcoverproportion socioeconomics Test different combinationsat different scales
Drivers offorestgain Model: GLM (binomial) stepwise, sample: 10’000 non- forestpixels at t1 Target variable: forestgain (yes/no) Explanatory variables: exposition (northeness/eastness), altitude, slope, distancetoforestedgeat 1st time step, distancetosettlement Adj D2
Drivers offorestloss Model: GLM (binomial) stepwise, sample 10’000 forestpixels at t1 Target variable: forestgain (yes/no) Explanatory variables: exposition (northeness/eastness), altitude, slope, distancetoforestedgeat 1st time step, distancetosettlement Adj D2
Explainingforestcoverbytopographyandpreviousforestcover? Model: GLM (binomial) stepwise, sample 10’000 of all pixels Target variable: forest (yes/no) Explanatory variables: exposition (northeness/eastness), altitude, slope, forestcover at previous time step Adj D2
Problem ofspatialautocorrelation Examplemodellinggain 1850-1880 Sample size 10’000 -> 819 Model performance (Adj D2) 0.35 -> 0.3 2 km distancethreshold
Drivers context climate/topo 1 ha raster (n=969’700) Target variable: forestloss/forestgain Administrative units Target variable: change in forestcoverproportion socioeconomics Test different combinationsat different scales
Appropriateadminunit? Forestcover vs. Population change ( relative changes 1940-2010) Communities (n=199) Districts (n=15) Forestcoverchange populationchange Relatively strong correlationwithproportionofolderpeople (60+) at districtlevel
Doespopulationchangesdriveforestcoverchange? • Whatistheappropriateresolution (adminunit)? • Absolute vs relative changes (fcandpc) • Time lag betweenpopchangeandforestcoverchange?